The powerful equity rally continued through June as the S&P 500 Total Return Index returned +5.09% for the month and has now returned +6.20% year-to-date. After reallocating to 33% S&P 500 exposure and 67% T-Bills exposure in mid-May, the MarketVector™-GammaRoad U.S. Equity Strategy Index (Bloomberg: MVGMMA Index) maintained its positioning through June and returned +1.93% for the month, which brought the strategy’s year-to-date return to +3.17%.
A natural topic for us to explore this month is how we might interpret the strategy’s conservative positioning as the market is making new all-time highs. Over the years we have witnessed considerable debate on the favorability of buying all-time highs for any market. This debate often reflects two schools of thought:
- The contrarian-minded investor might expect this to be an unfavorable entry point, given that a market making a new all-time high has likely just experienced a significant run already, and therefore the opportunity for further gains is limited.
- The momentum-minded investor might find this to be an attractive entry point, as a market that is making new all-time highs is likely showing considerable strength on an absolute basis.
The contrarian investor accepts the risk of missing considerable upside, while the momentum investor accepts the risk that the recent strength has run its course and the market subsequently reverses direction. Both approaches have merit and can provide valuable risk management elements to nearly any investment process.
An objective, rules-based approach can attempt to incorporate these benefits while remaining adaptive enough to estimate which approach might prevail whenever this scenario arises. As mentioned earlier, we enter July with the MVGMMA Index positioned at 1 out of 3 measures bullish while the S&P 500 Index closed June at a newly minted all-time high. We decided to look through MVGMMA’s full research period since its base date of January 29, 1993 to examine prior periods where only 1 of the strategy’s 3 measures are bullish and the S&P 500 Index is within 5% of its all-time highest close. The following chart of the strategy’s signal changes over time highlights these periods:
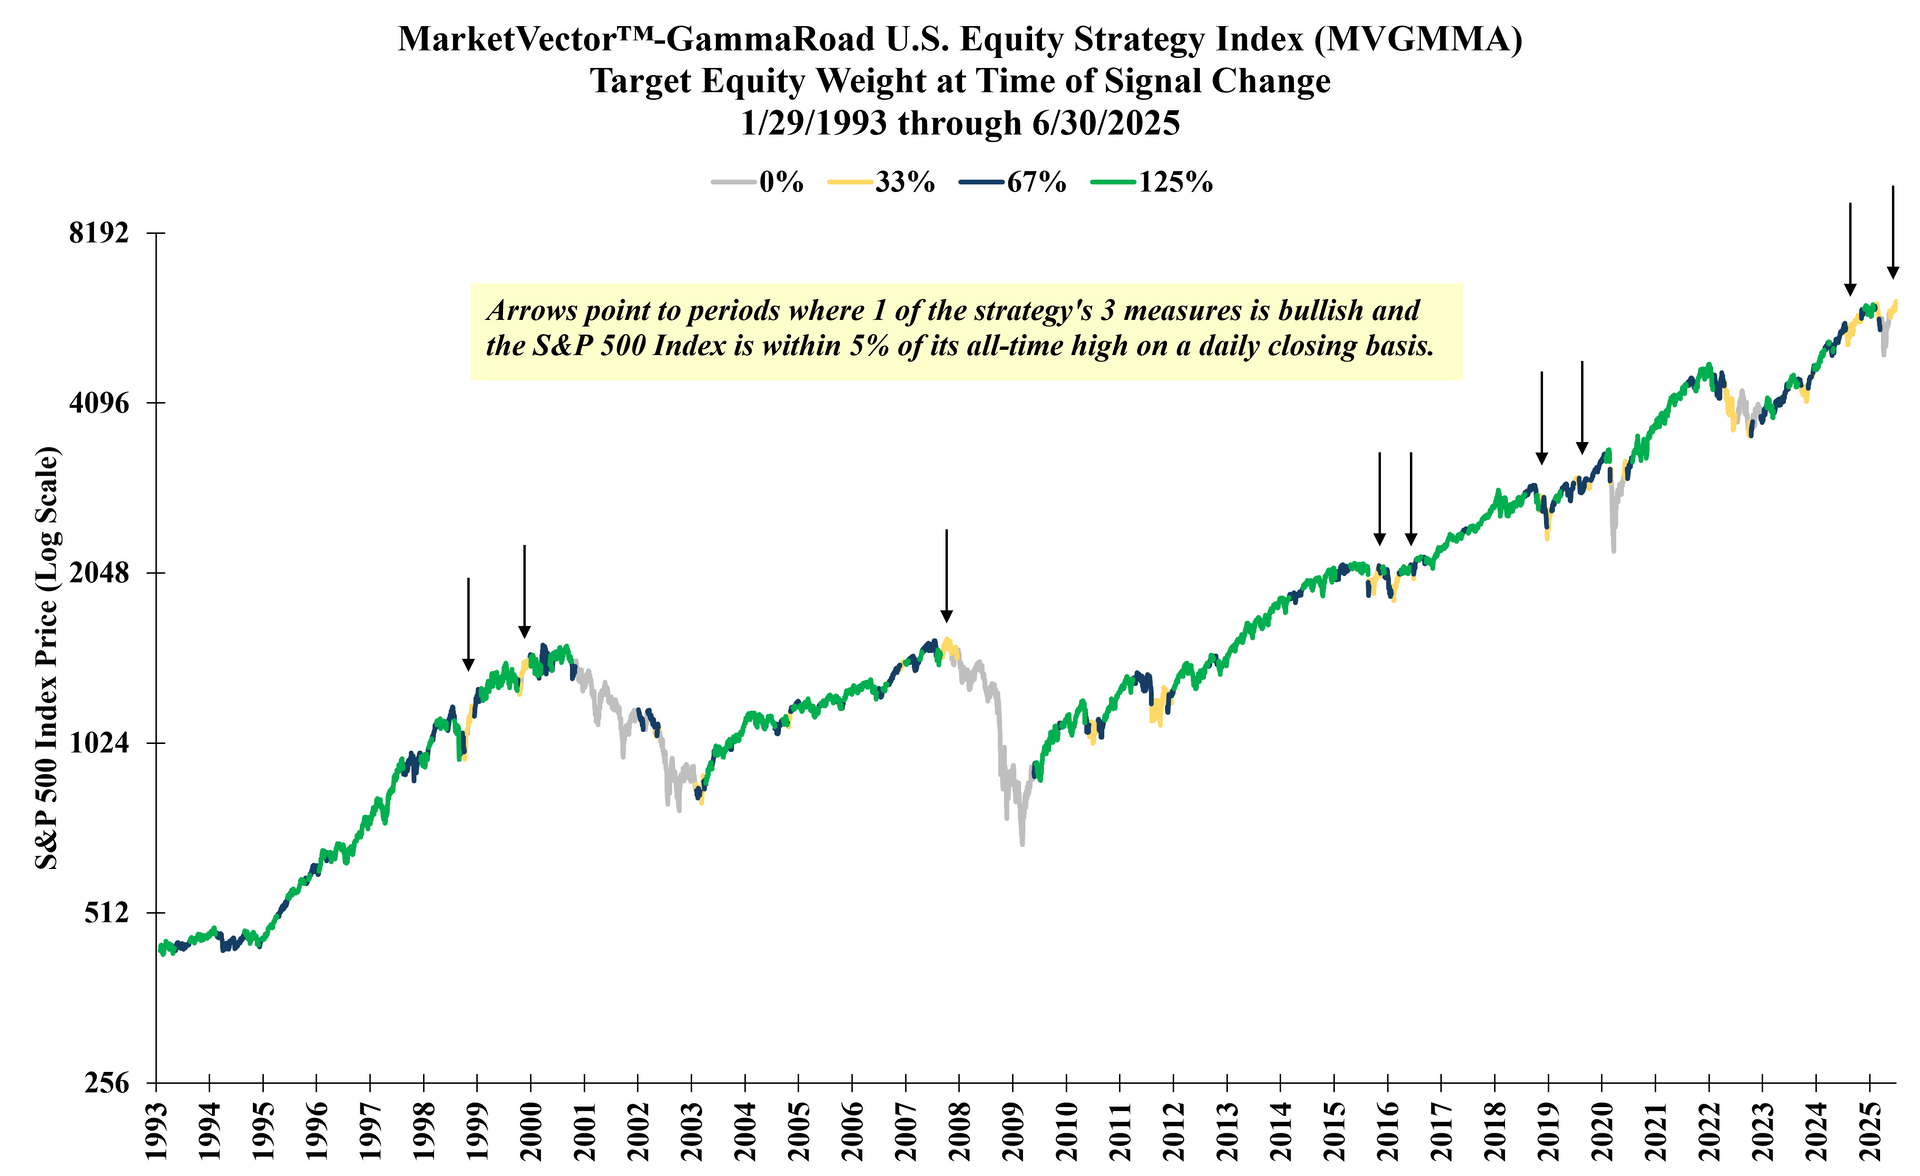
Source: GammaRoad Capital Partners, LLC. The S&P 500 Index is shown here on the y-axis to illustrate the index price level as the MarketVector™-GammaRoad U.S. Equity Strategy Index (Bloomberg: MVGMMA Index) target equity weight changes over time. The MVGMMA Index launched on December 22, 2023. Prior to December 22, 2023, the above target equity weight changes reflect backtested information based on the application of the MVGMMA Index methodology to the S&P 500 Index price data during periods when the MVGMMA Index was not actually published. Please see the important disclosures that are integral to understanding the limitations applicable to the quantitative information in the presentation.
We observe that the picture above reflects the contrarian-versus-momentum dilemma described earlier when 1 out of 3 measures is bullish and yet the market is near its all-time high. The chart shows periods such as late 1999 and late 2007, where the strategy indicates a far riskier equity environment than the prevailing price trend suggests, and the market is experiencing a significant inflection point in risk. We can also see periods like late 2015 and early 2016, where the market marched higher in anticipation of an improving market environment and the strategy’s bearish measures improved shortly thereafter.
The next chart shows the average short-term and intermediate-term returns for the S&P 500 Total Return Index when only 1 of the strategy’s 3 measures is bullish (i.e. the MVGMMA Aggregate Index Signal = 1), and separates these periods into those when the market is within 5% of its all-time high versus when the market is further away from its all-time high:
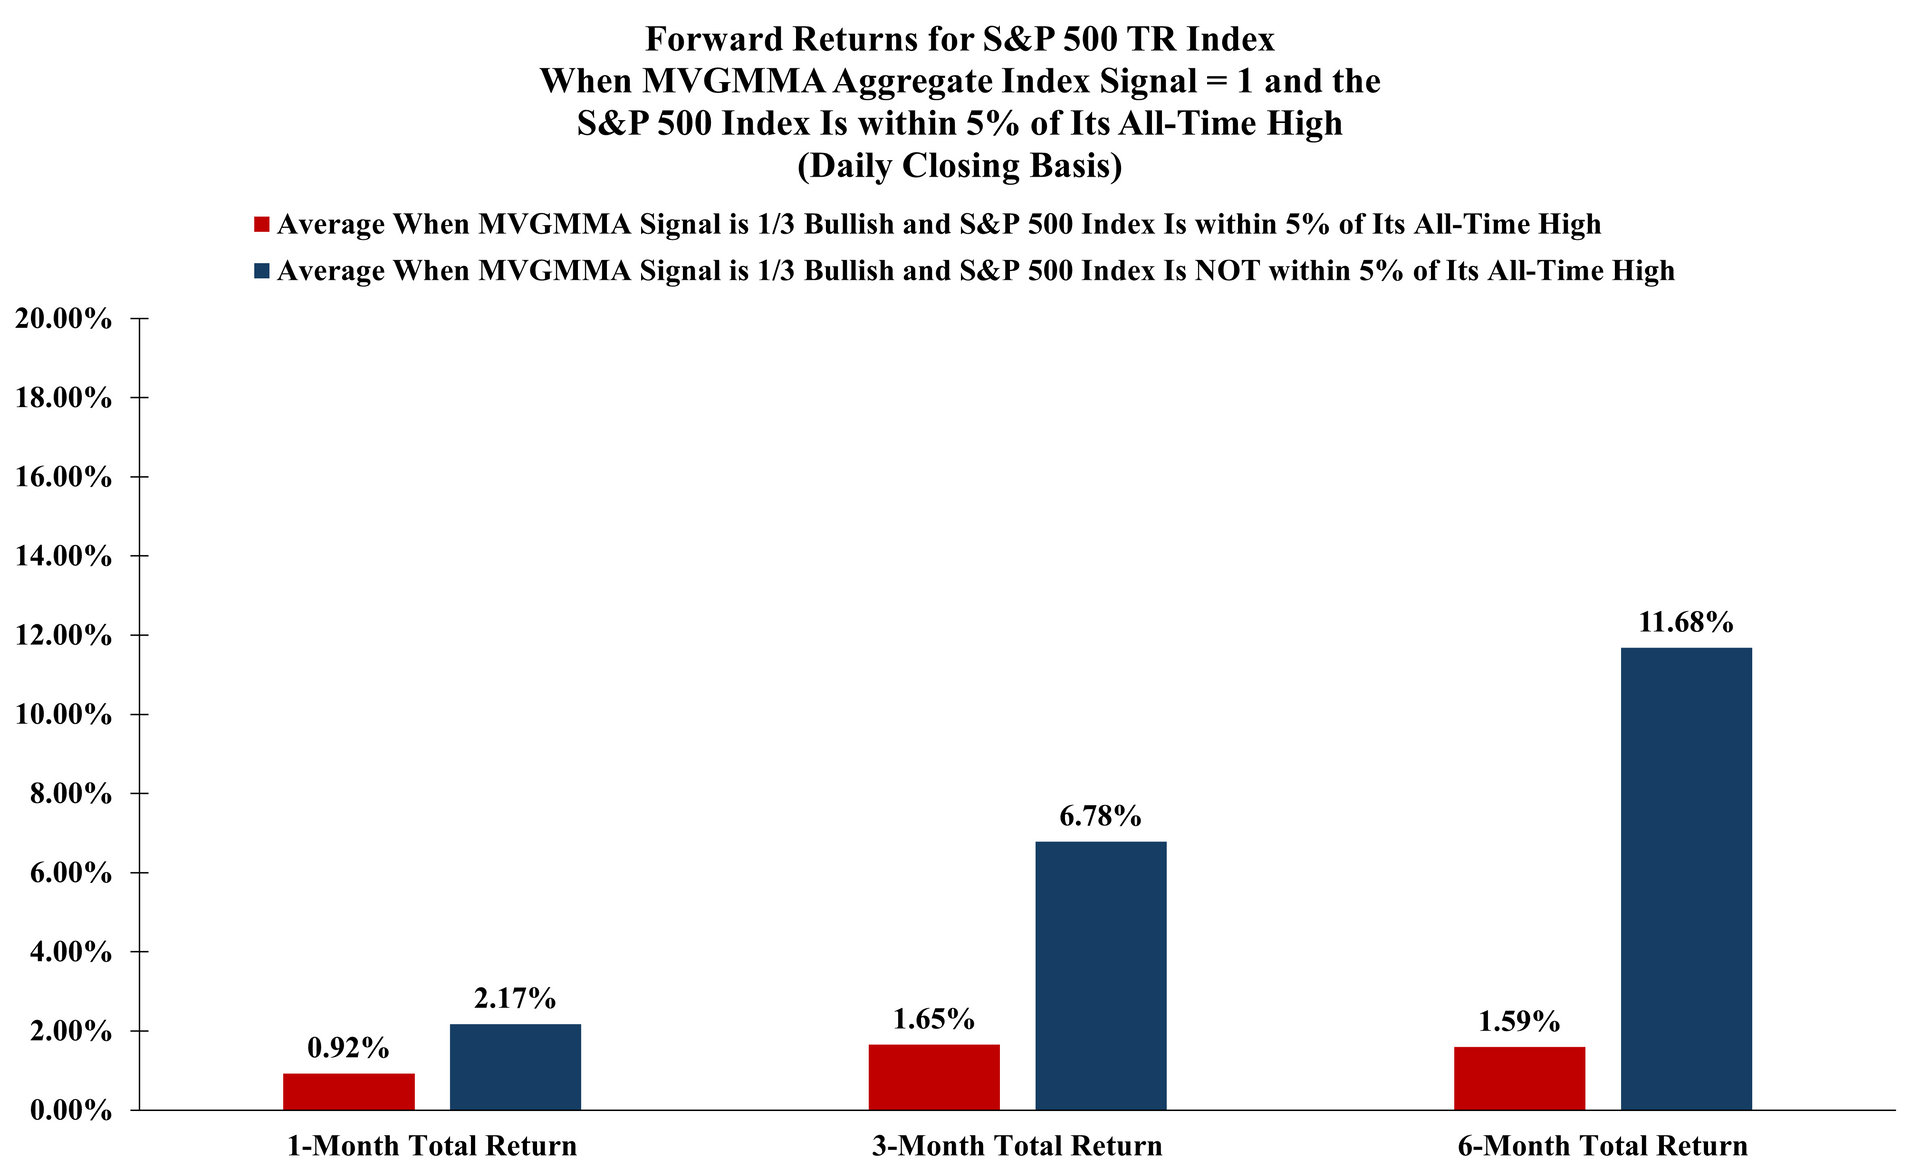
Source: GammaRoad Capital Partners, LLC. This chart depicts the average returns for the S&P 500 TR Index through points in time during which the MVGMMA Aggregate Index Signal (“AIS”) has a value of ‘1’ (i.e. only 1 of the strategy’s 3 measures is bullish) and the S&P 500 Index (price-only) is either within or not within 5% of its all-time highest closing price. The MVGMMA Index launched on December 22, 2023. Prior to December 22, 2023, all data points shown herein reflect periods when the MVGMMA Index was not actually published. Past performance is not indicative of future results. Please see the important disclosures that are integral to understanding the limitations applicable to the quantitative information in the presentation.
The next chart shows this same comparison using the median rather than the average:
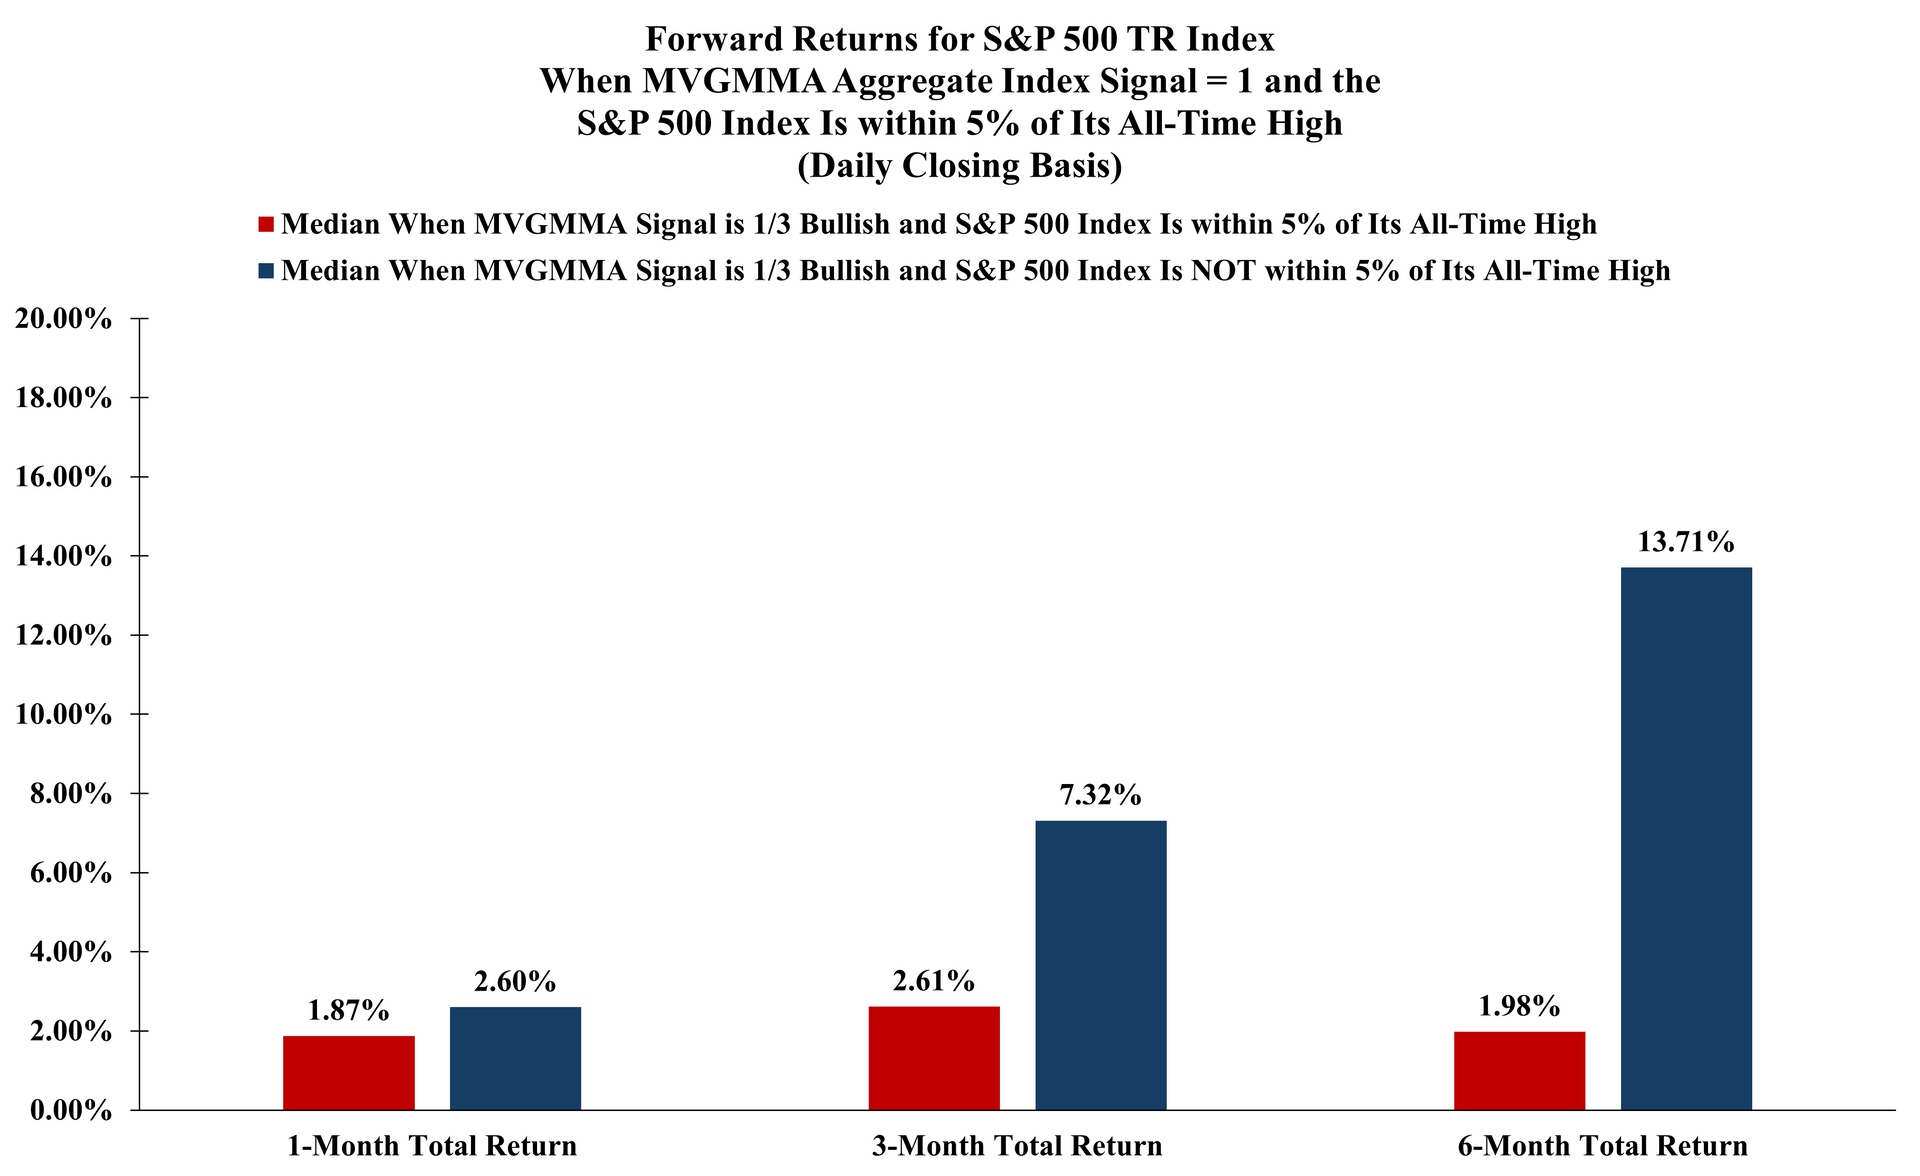
Source: GammaRoad Capital Partners, LLC. This chart depicts the median returns for the S&P 500 TR Index through points in time during which the MVGMMA Aggregate Index Signal (“AIS”) has a value of ‘1’ (i.e. only 1 of the strategy’s 3 measures is bullish) and the S&P 500 Index (price-only) is either within or not within 5% of its all-time highest closing price. The MVGMMA Index launched on December 22, 2023. Prior to December 22, 2023, all data points shown herein reflect periods when the MVGMMA Index was not actually published. Past performance is not indicative of future results. Please see the important disclosures that are integral to understanding the limitations applicable to the quantitative information in the presentation.
Our main observation from these charts is that throughout the research period, the forward short-term and intermediate-term total returns for the market can be significantly lower when only 1 of the strategy’s 3 risk measures is bullish and the market is near its all-time high.
We show this comparison using both average and median forward returns, as we like to use multiple measures of central tendency wherever possible. Here we see the median values are meaningfully higher than the average values for the periods near the all-time high (the red bars in the second chart are higher than the red bars in the first chart), which indicates that these averages are heavily skewed by disproportionately larger losses.
As always, we should remain cognizant that this is a limited set of examples from the research period, and we look through these simply as another attempt to understand what the strategy’s current positioning might imply for the current market environment.
Most importantly, we should reiterate that there is no predictive element to this analysis or to the strategy’s architecture overall. The strategy’s process is entirely (and intentionally) reactive as its three measures recalculate and estimate the changing favorability of current market conditions. This is why we repeatedly characterize the strategy’s process as a “nowcast” rather than a forecast.
An observer may also ask, “Given the charts above, why not use the 1-out-of-3 bullish measurement as a contrarian signal when the market is further away from its all-time high?” The answer reflects our respect for the uncertainty of the future and our belief in the durability of the systematic process. Just because this scenario presents this way in a limited set of examples during the research period does not mean that it will play out this way again in the future. We simply do not know and cannot know. Therefore we choose to minimize the degrees of conditionality and the number of variables in any rules-based process as much as possible. We find that this approach can significantly improve our expectations for a systematic strategy’s durability over time. We cover our thought process on this aspect of system design in further detail here.
We enter July with the strategy’s price direction measure as the only bullish driver. If this proves to be another scenario where the strategy’s measures are correctly characterizing the risk environment despite the market’s lofty level, then the strategy is well-positioned to mitigate any resurgence in volatility.
If instead the market’s impressive rally is anticipating a meaningful transition to more favorable market conditions, then we would expect the strategy’s measures for consumer confidence and economically sensitive asset relationships to improve commensurately and increase the strategy’s equity exposure.
For a refresher on the strategy’s architecture and underlying process, please watch our video here.
Important Disclosures
THIS PRESENTATION AND THE INFORMATION CONTAINED HEREIN WAS PREPARED BY GAMMAROAD CAPITAL PARTNERS, LLC (“GAMMAROAD”) AND IS SUBJECT TO AND QUALIFIED BY THE IMPORTANT DISCLOSURES BELOW.
Confidential
This presentation is directed solely to existing and potential users of the MarketVector™-GammaRoad U.S. Equity Strategy Index (Bloomberg: MVGMMA Index,
“MVGMMA Index”) and is furnished on a confidential basis only for the use of the recipient and only for discussion purposes. This presentation and its contents are proprietary information of GammaRoad and may not be reproduced or otherwise disseminated in whole or in part without GammaRoad’s prior written consent.
Not Advice or Recommendation
This presentation is neither advice nor a recommendation to enter into any transaction. This presentation is for information, illustration and discussion purposes only and is not intended as an offer to buy or sell, nor a solicitation of an offer to buy or sell, any security, commodity or other financial instrument. Nothing contained in this presentation is intended to represent the rendering of accounting, tax, legal, regulatory or investment advice by GammaRoad. While investors should understand and consider the risks associated with making an investment decision, this presentation should not be relied upon for that purpose and should not be a basis of any investment decision or retention of the MVGMMA Index. This presentation and the MVGMMA Index do not take into account the particular investment objectives, financial circumstances, restrictions, particular needs or financial, accounting, regulatory, legal or tax situation of any particular person, investor or type of investor. Neither GammaRoad nor its principals, officers, employees or associated funds or entities (all of the foregoing collectively, “Related Persons”) hereby makes any representation to any person or entity as to the suitability of the MVGMMA Index or any investments nor provide advice or recommendations regarding an investor’s decision to allocate funds based on the use of the MVGMMA Index or to maintain or sell investments based on the MVGMMA Index.
An investment decision by you to employ the MVGMMA Index in any capacity should be based on your independent judgment and customary and thorough due diligence procedures, including consultation with your own professional tax, legal and investment advisors. You should also inform yourself as to: (1) the legal requirements within your jurisdictions for the purchase, holding or disposal of investments; and (2) any income and other taxes which may apply to the purchase, holding and disposal of investments. Furthermore, you should keep in mind that any subsequent change in facts or circumstances could materially affect the accounting, tax, legal or regulatory treatment consequences of the MVGMMA Index and investments. Before you make any investment decisions based on the MVGMMA Index, you should determine whether the investment is suitable for you in light of your circumstances, investment objectives, financial situation and risk tolerance.
GammaRoad is not an Advisor or a Fiduciary
GammaRoad is not and does not purport to be an advisor as to legal, taxation, accounting, financial or regulatory matters in any jurisdiction. GammaRoad is not registered with any federal or state regulator and no fiduciary relationship under federal and/or state securities laws, the Commodity Exchange Act and/or ERISA is created by investing based on the MVGMMA Index, or through any communication with GammaRoad.
Limitation on Liability
No liability whatsoever is accepted for any loss (whether direct, indirect, or consequential) that may arise from any use of the information contained in or derived from this presentation or by use of the MVGMMA Index. In addition, GammaRoad, disclaims any and all liability as to the completeness or accuracy of the information contained herein and for any omissions of material facts. However, nothing herein shall in any way constitute a waiver or limitation of any rights available under applicable federal or state laws.
MVGMMA Index is Subject to Change
Please reference the MVGMMA Index Guide at www.marketvector.com/rulebooks/download/MVGMMA_Index_Guide.pdf for information regarding the development of the MVGMMA Index, its methodology and its risk management techniques.
Any changes to the Index Guide will be reviewed and approved by MarketVector Indexes (“MarketVector”) and MarketVector’s Legal and Compliance Department. MarketVector’s Legal and Compliance Department may also request a conclusive description and further information on any change and may consult MarketVector’s operations department on such changes. The key elements to be analyzed in this phase of the change process are robustness, transparency, reliability and integrity. The result of the review will be communicated to MarketVector’s operations department. The email will be archived by MarketVector’s operations department.
Changes that might immediately change the composition of the MVGMMA Index or must be considered material for any other reason also need to be approved by MarketVector’s Independent Oversight Function (“IOF”) prior to their publication and implementation.
In case of material changes an advance notice will be published and provided to users by MarketVector. MarketVector will generally disseminate a notification related to an Index Guide change 30 days prior to the change. A shorter period of time may be applied at MarketVector’s discretion if the relevant index has not been licensed for a financial product to a third party. The notice will describe a clear time frame that gives the opportunity to analyze and comment upon the impact of such proposed material change. Any material comments received in relation to the Index Guide change and MarketVector’s response to those comments will be made publicly accessible after any consultation, except where confidentiality has been requested by the originator of the comments.
Investment Performance
All performance information reflects the performance of the MarketVector™-GammaRoad U.S. Equity Strategy Index and does not reflect the trading of an actual account. The MVGMMA Index launched on December 22, 2023. Prior to December 22, 2023, all performance shown herein reflects backtested information based on the application of the MVGMMA Index methodology to the SPDR® S&P 500® ETF Trust (“SPY”) and the ProShares Ultra S&P500® (“SSO”) price and dividend data for the MVGMMA Index’s equity component during periods when the MVGMMA Index was not actually published. Prior to the inception of the SSO, the performance exhibits use twice the daily return of the SPY minus the daily equivalent of the SSO’s total expense ratio. For the non-equity component of the MVGMMA Index, the performance exhibits use the daily return and dividends for the SPDR® Bloomberg 1-3 Month T-Bill ETF (“BIL”). Prior to the inception of the BIL, the performance exhibits use a cash return that is the daily equivalent of the market yield on U.S. Treasury Securities at 3-Month Constant Maturity minus the daily equivalent of the BIL’s total expense ratio. The slides that show target equity weight changes apply the MVGMMA Index methodology to the S&P 500 Index price data during the periods shown. Both the S&P 500 TR and the S&P 500 Index (collectively the “S&P 500 Indices”) are indices comprised of the same 500 stocks chosen from all major industries based on market size, liquidity and industry grouping, among other factors. The difference between the S&P 500 TR and the S&P 500 Index is that the S&P 500 TR reflects the reinvestment of dividends while the S&P 500 Index does not. Investments cannot be made directly in broad-based securities indices. Therefore, the application of the MVGMMA Index methodology to the S&P 500 Indices is for illustration purposes only to demonstrate the efficacy of the MVGMMA Index methodology applied to these indices. January 29, 1993 was chosen as the base date for the MVGMMA Index so that the full research period would coincide with the inception of the SPDR® S&P 500® ETF Trust (“SPY”), which has the longest history amongst the largest and most liquid ETFs that passively track the S&P 500 Index. Additional information about the S&P 500 Indices and the U.S. Treasury Securities at 3-Month Constant Maturity is available from GammaRoad upon request.
The investment performance shown includes the reinvestment of dividends, interest and capital gains according to the MVGMMA Index and there was no withdrawal of cash during the performance period. In addition, you may pay brokerage commissions, exchange fees, and clearing fees to execute the MVGMMA Index methodology, none of which are subtracted in calculating the back-tested performance shown. Differences in the methodology used to calculate performance may also lead to different performance results than those shown. Annualized total return is computed on a compounded monthly basis. Volatility (standard deviation) and maximum drawdown percentage are computed on a daily basis. Beta and skew are computed on a monthly basis.
Back-tested performance is a type of hypothetical performance that cannot completely account for the impact of financial risk in actual management of a portfolio. In fact, there can be sharp differences between hypothetical performance results and the actual results subsequently achieved by any particular investment strategy due to many factors, some of which are described below. For example, the ability to withstand losses and adhere to the MVGMMA Index methodology in spite of trading losses is unknown and could have adversely affected actual results. Furthermore, back-tested performance results are prepared with the benefit of hindsight. This means that the MVGMMA Index has been formed in the present based in part on application of the MVGMMA Index methodology to the SPY, SSO, and BIL ETFs during the back-tested periods. The MVGMMA Index may have been constructed differently if GammaRoad did not have the benefit of its current hindsight and the MVGMMA Index may have performed significantly worse than the performance reflected herein. Furthermore, if the MVGMMA Index changes, the back-tested performance shown is not indicative of how the MVGMMA Index will perform if these changes occur. In addition, as noted above the back-tested performance shown does not subtract any brokerage commissions, exchange fees, and clearing fees. For the foregoing reasons and for numerous other reasons related to the markets, no representation is made that any investor using the MVGMMA Index will or is likely to achieve profits or losses similar to those shown.
Performance may vary substantially from year to year or even from month to month. Differences in the timing of transactions and market conditions prevailing at the time of investment may lead to different results. The value of investments can go down as well as up. Past performance is not indicative of future results and GammaRoad makes no representation that any user of the MVGMMA Index will or is likely to achieve profits or losses similar to those shown herein.
Benchmark Comparison
The performance shown is compared to the S&P 500 TR. The comparisons to the S&P 500 TR are included merely to show the general performance in the market in the periods indicated and is not intended to imply that the MVGMMA Index is similar to the S&P 500 TR in either composition or element of risk. Investments cannot be made directly in a broad-based securities index.
Risk of Loss and Other Risks
Investing in securities entails certain risks, including the possible loss of the entire principal amount invested. Volatility and returns depend on a variety of factors including overall market conditions, and unpredictable economic and political events.
All projections, valuations, and statistical analyses are provided to assist the recipient in the evaluation of the matters described herein. Such projections, valuations and analyses may be based on subjective assessments and assumptions and may use one among many alternative methodologies that produce different results; accordingly, such projections, valuations and statistical analyses should not be viewed as facts and should not be relied upon as an accurate prediction of future events.
Investments pursuant to the MVGMMA Index may be exposed to risks relating to non-U.S. markets, including, without limitation, risks relating to currency exchange, tax, lack of liquidity, market manipulation, political instability and higher transaction costs.
No representation is made that the MVGMMA Index's investment processes, investment objectives, goals or risk management techniques will or are likely to be achieved or successful, or that the MVGMMA Index methodology and/or any investment will make any profit or will not sustain losses. The MVGMMA Index may not be suitable for everyone.
Conflicts of Interest
GammaRoad’s Related Persons may invest personal assets pursuant to the MVGMMA Index methodology. To address potential conflicts of interest with the investing of users of the MVGMMA Index, GammaRoad has instituted an internal Personal Trading Policy with which all Related Persons are required to comply. With respect to each GammaRoad strategy, GammaRoad’s Personal Trading Policy seeks to allow users to have the opportunity to trade before and at better prices than Related Persons. A copy of GammaRoad’s Personal Trading Policy is available upon request.
Limitations on Information Contained Herein
This presentation is based on information including, but not limited to third-party benchmark information, that has been obtained from sources that GammaRoad believes to be reliable; however, such information has not been independently verified. GammaRoad (i) makes no representation as to, and accepts no responsibility or liability for, the accuracy, truthfulness or completeness of the information; (ii) and does not represent it as accurate, true or complete; (iii) makes no warranty, express or implied regarding it; and (iv) shall not be liable for any losses, damages, costs or expenses relating to its adequacy, accuracy, truth, completeness or use unless the waiver of such liability constitutes the waiver of any rights you may have under applicable federal or state laws.
The information in this presentation is current as of the date indicated and is subject to change or amendment. The delivery of this presentation at any time does not imply that the information contained herein is correct at any time subsequent to such date. GammaRoad undertakes no responsibility or obligation to revise or update this presentation and/or the opinions, statements, assumptions, analyses, assessments, projections, forward looking statements, similar statements and other views expressed in this presentation (collectively, the “Statements”). All Statements constitute only subjective views of GammaRoad, should not be relied on, and are subject to change without notice due to many factors, including fluctuating market conditions, and economic factors.