U.S. Equity Strategy Updates
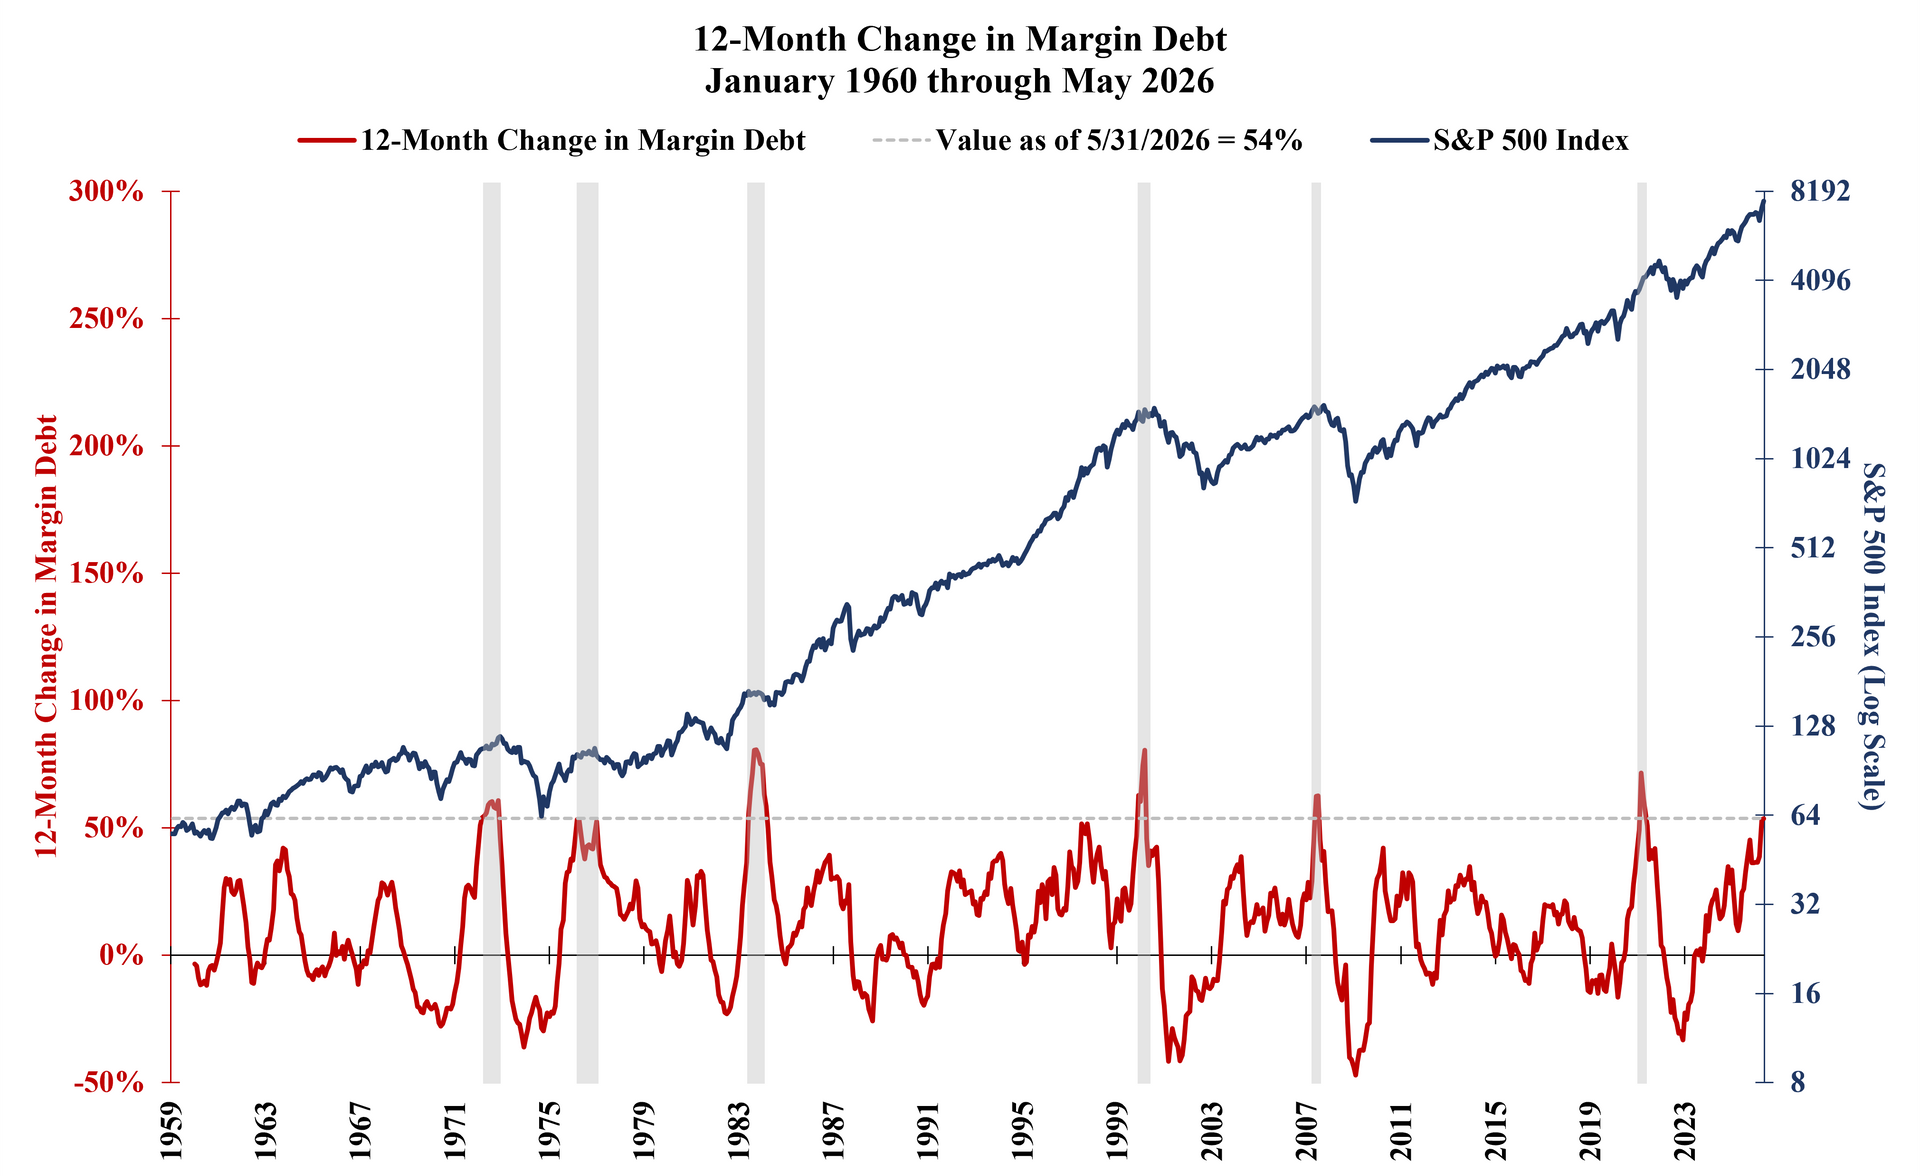
As the chorus of “Is this a bubble?” steadily increases in financial media and investor discussions, this month we examine margin debt through several lenses...
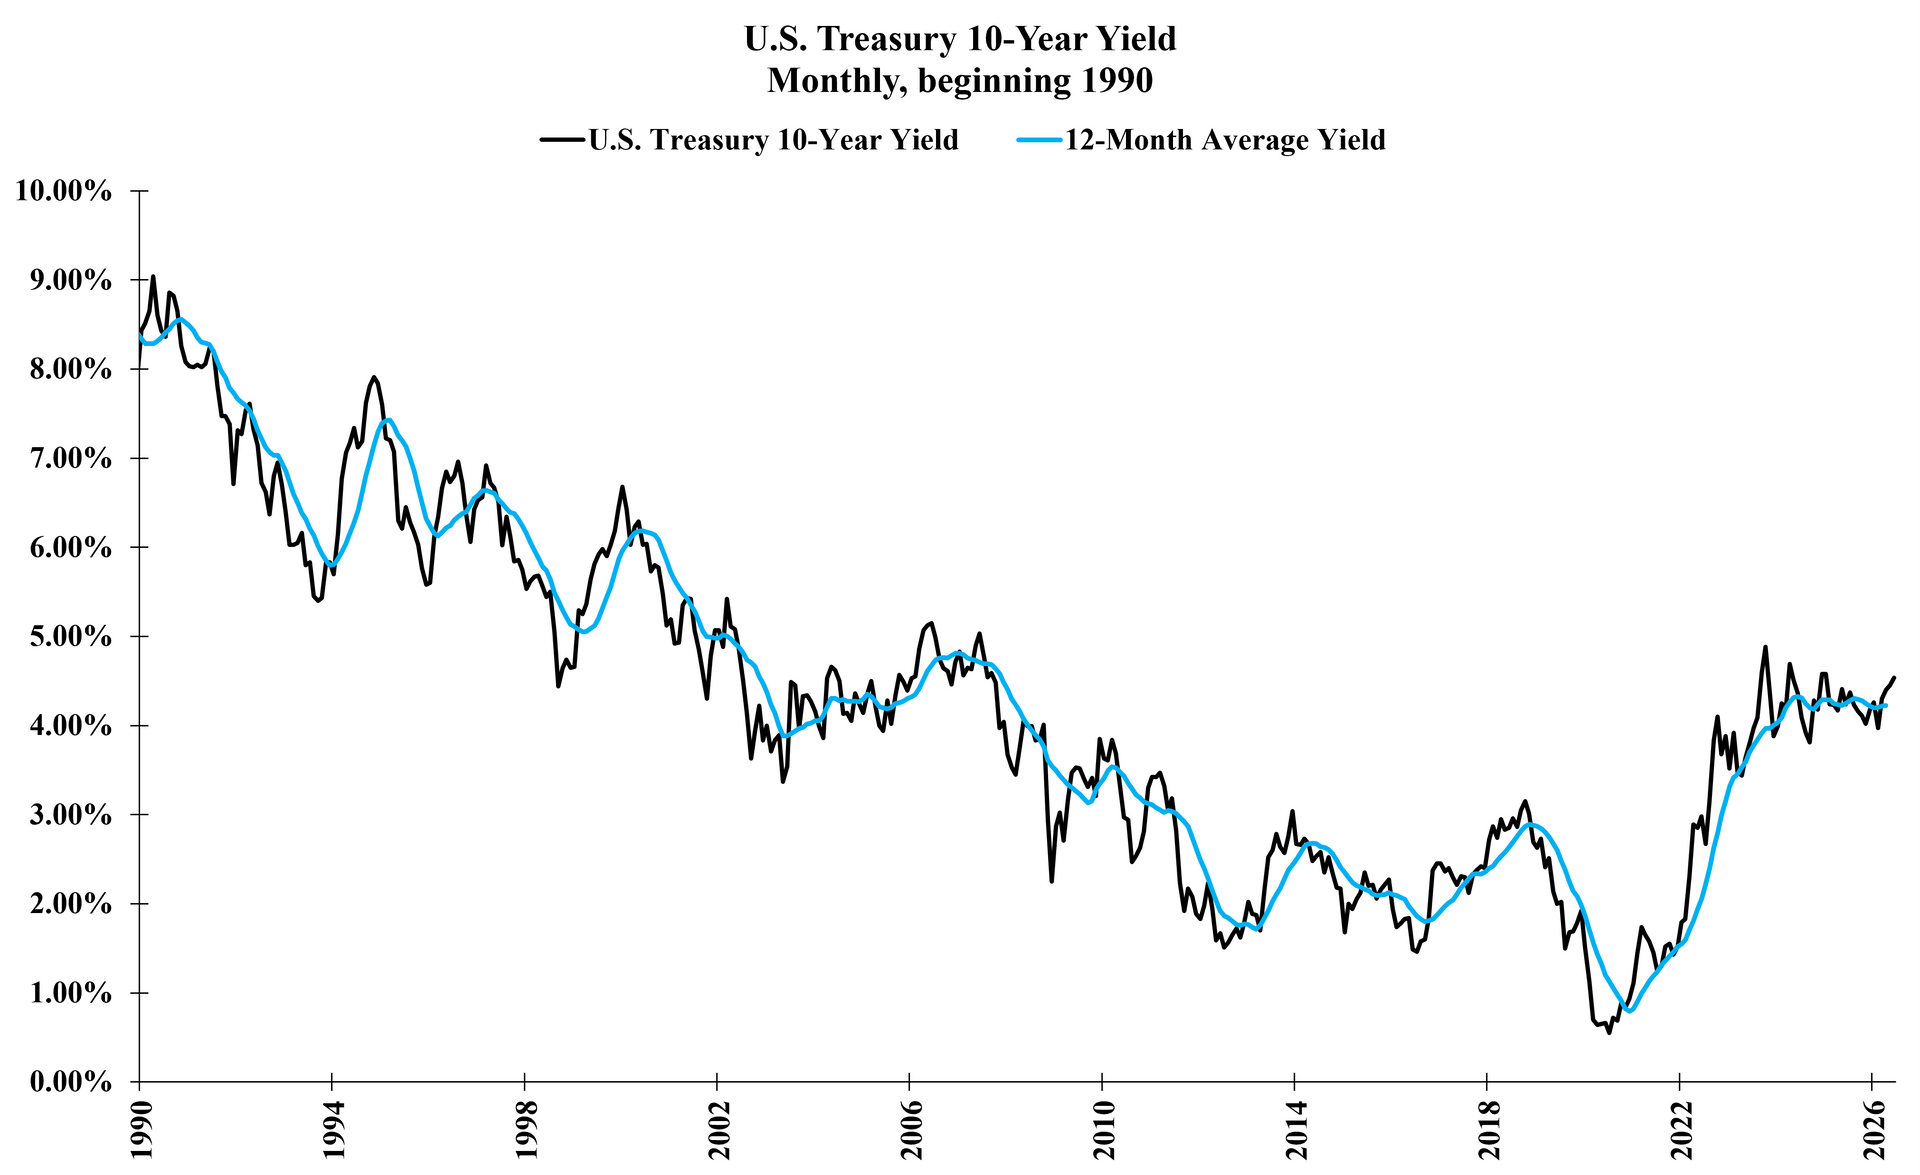
Be wary of suggestions that “Rising rates do not matter for stocks.” As the inflationary impulse reverberates across asset classes and the economy, we explore the longer-term impact of rate trends on the equity market...
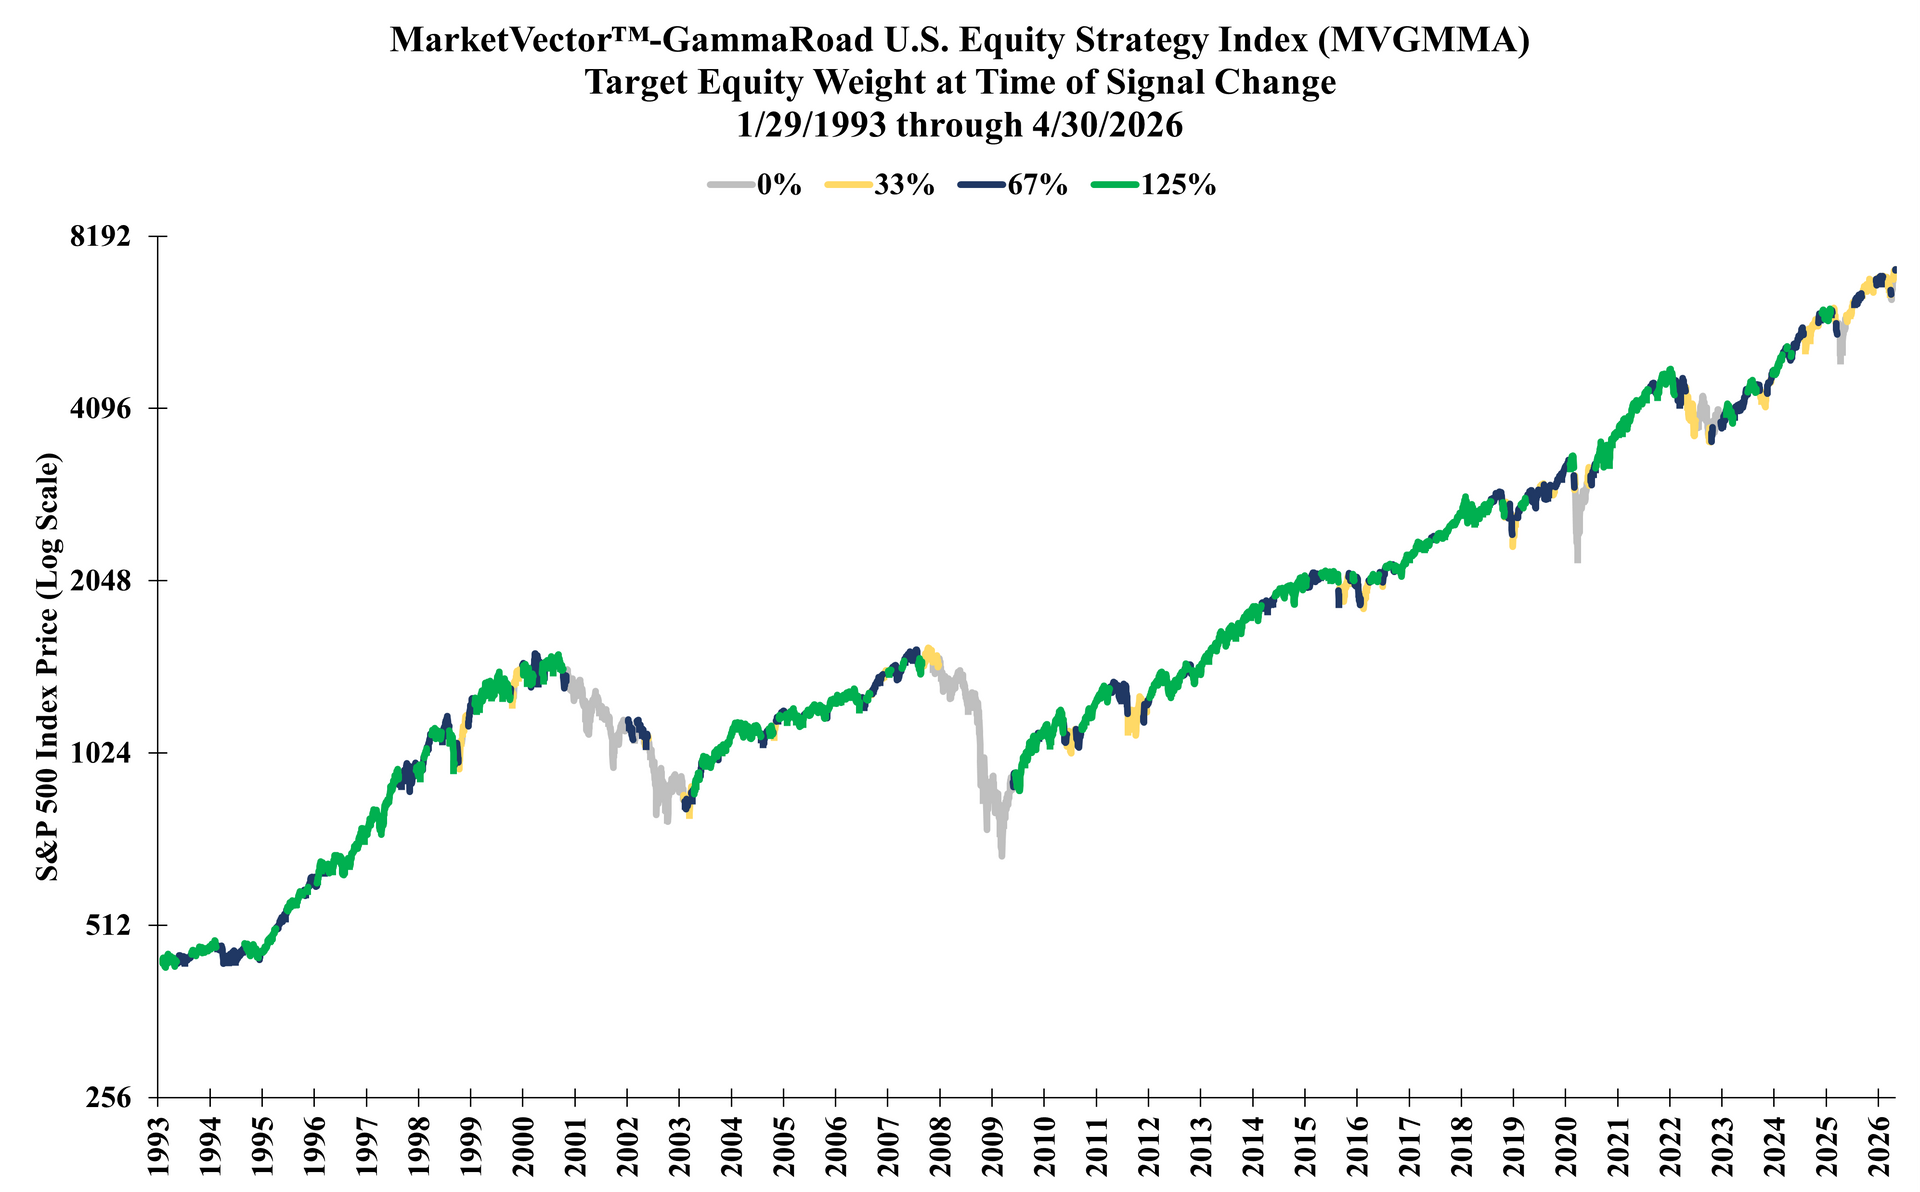
As market conditions swiftly improved through April, the MarketVector™-GammaRoad U.S. Equity Strategy Index responded by increasing equity exposure twice during the month...

While the Middle East conflict, the deterioration in private credit and concerns over AI disruption continue to fuel market volatility, the MarketVector™-GammaRoad U.S. Equity Strategy Index reallocated to 100% T-Bills exposure in late March...
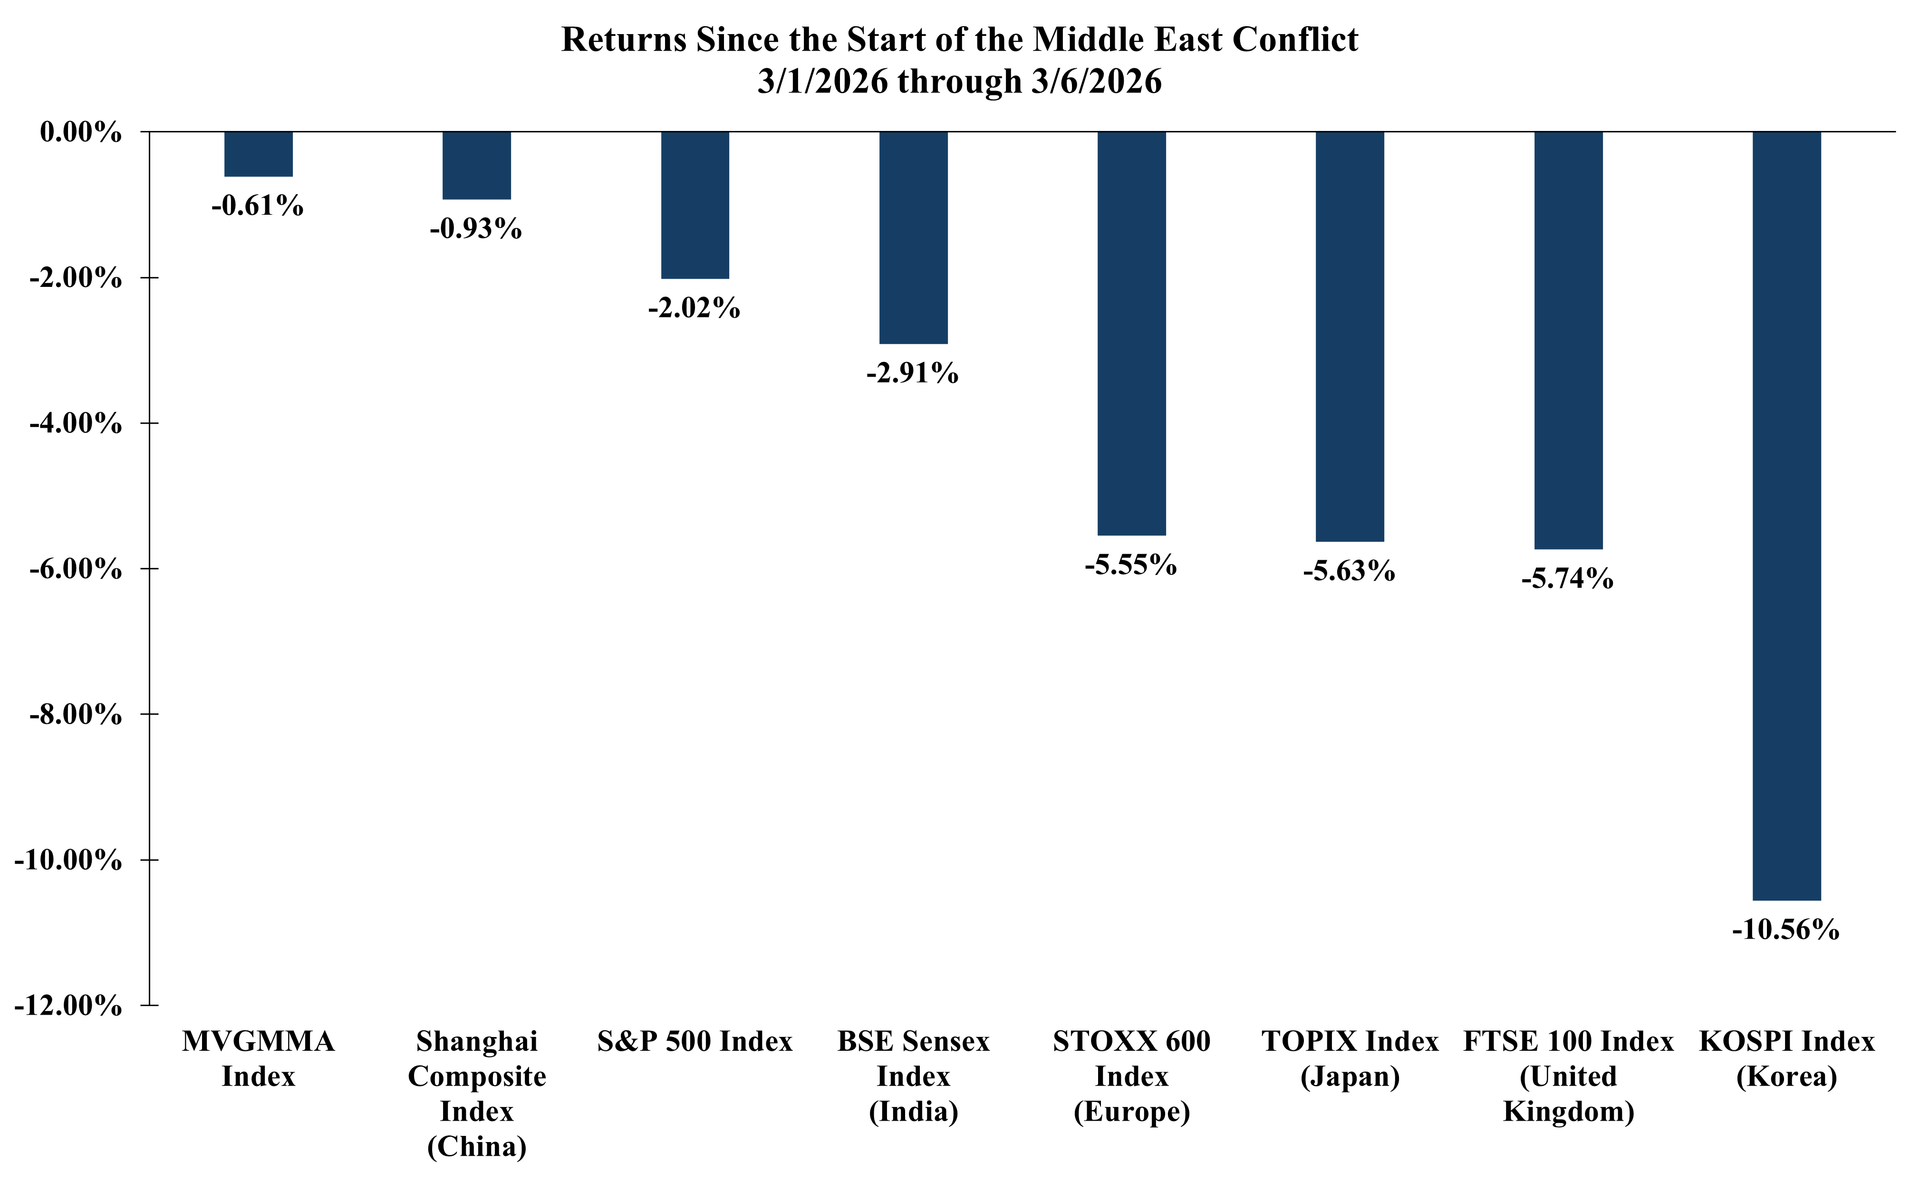
Through the cross-currents of military conflict, tightening natural resource supplies, AI disruption, and private credit concerns, the MarketVector™-GammaRoad U.S. Equity Strategy Index maintained its conservative positioning to enter March...
Investors were rewarded with a positive start to the year as the S&P 500 Total Return Index returned +1.45% for January. The MarketVector™-GammaRoad U.S. Equity Strategy Index (Bloomberg: MVGMMA Index), which had reallocated at the end of 2025...
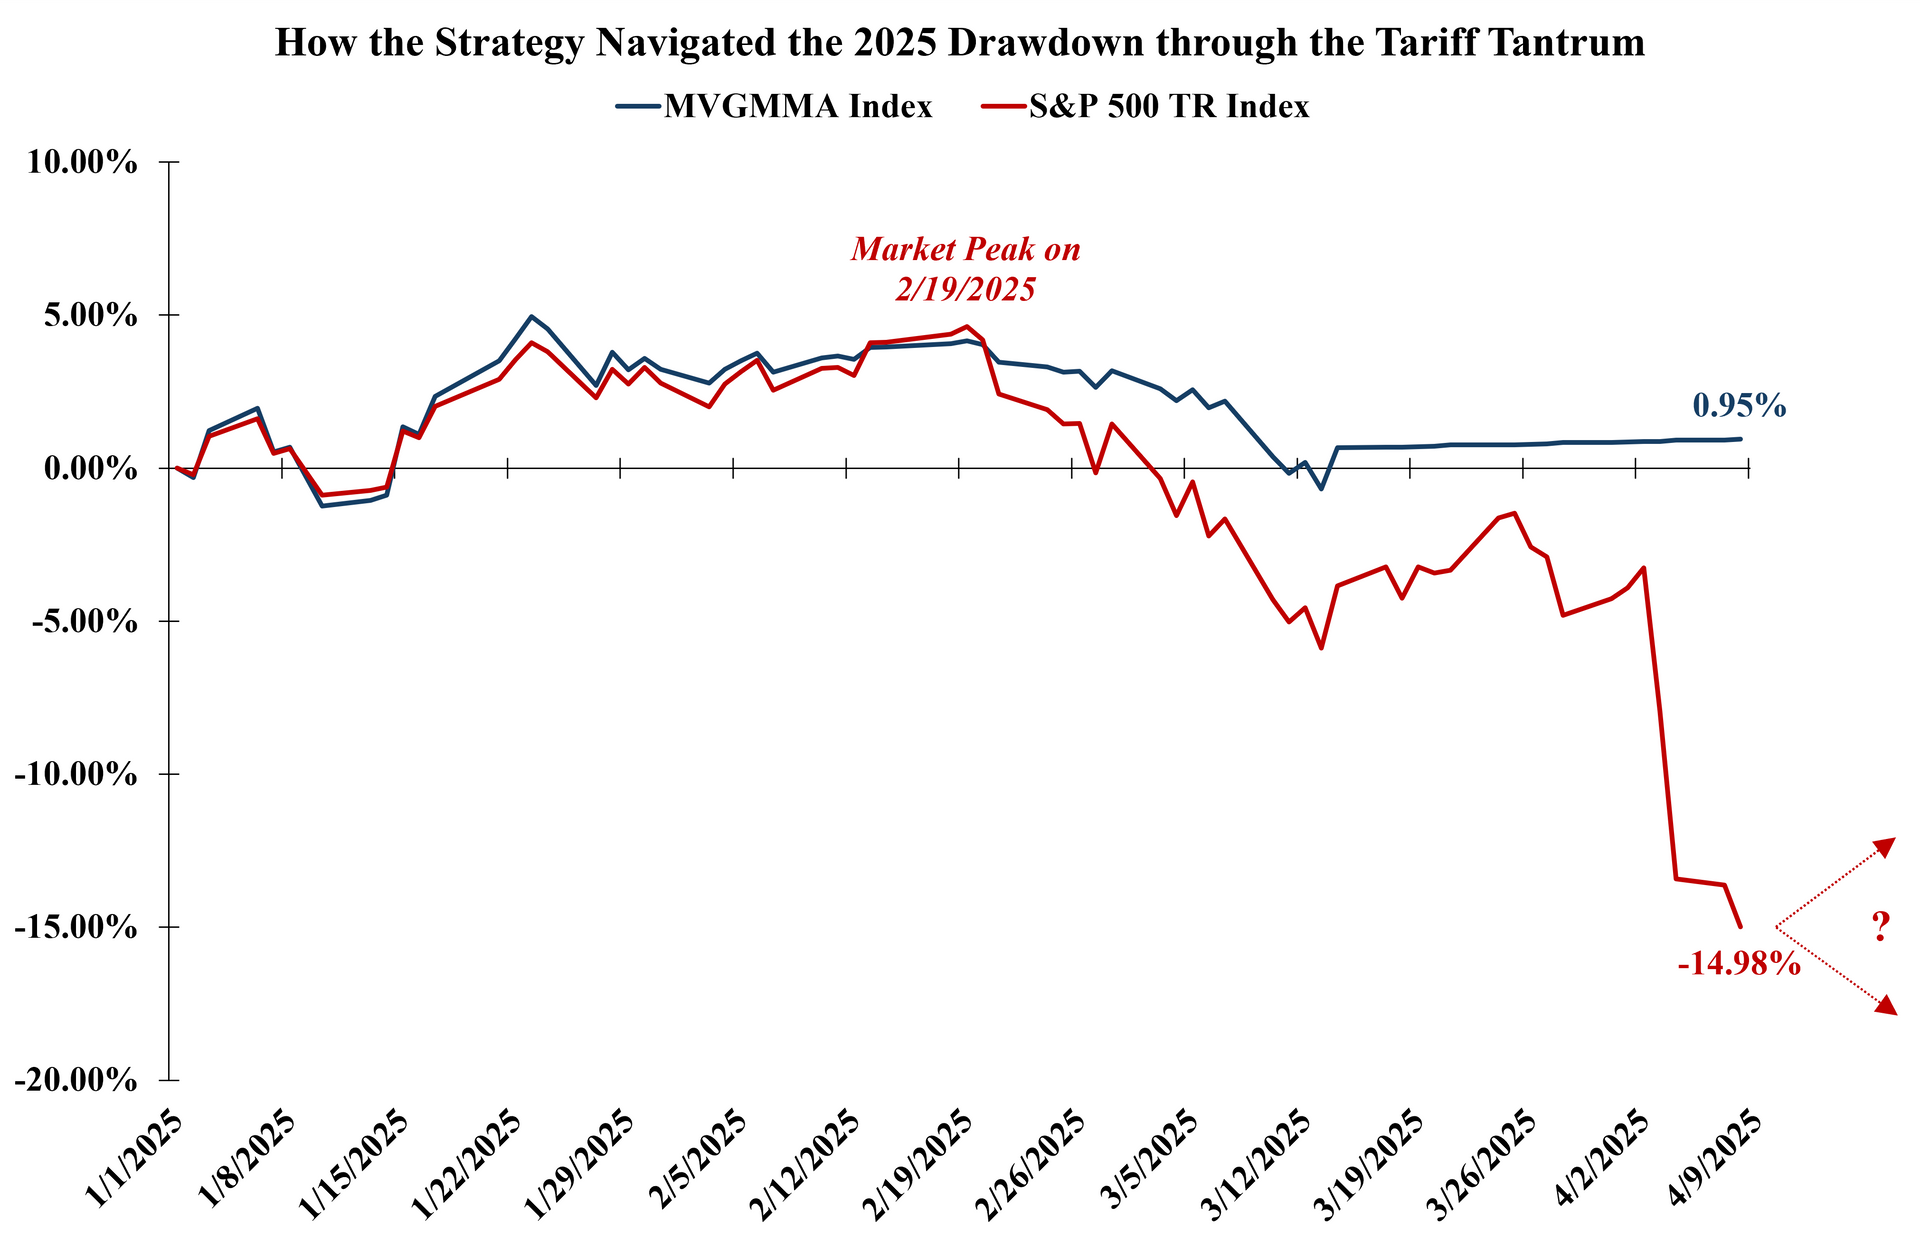
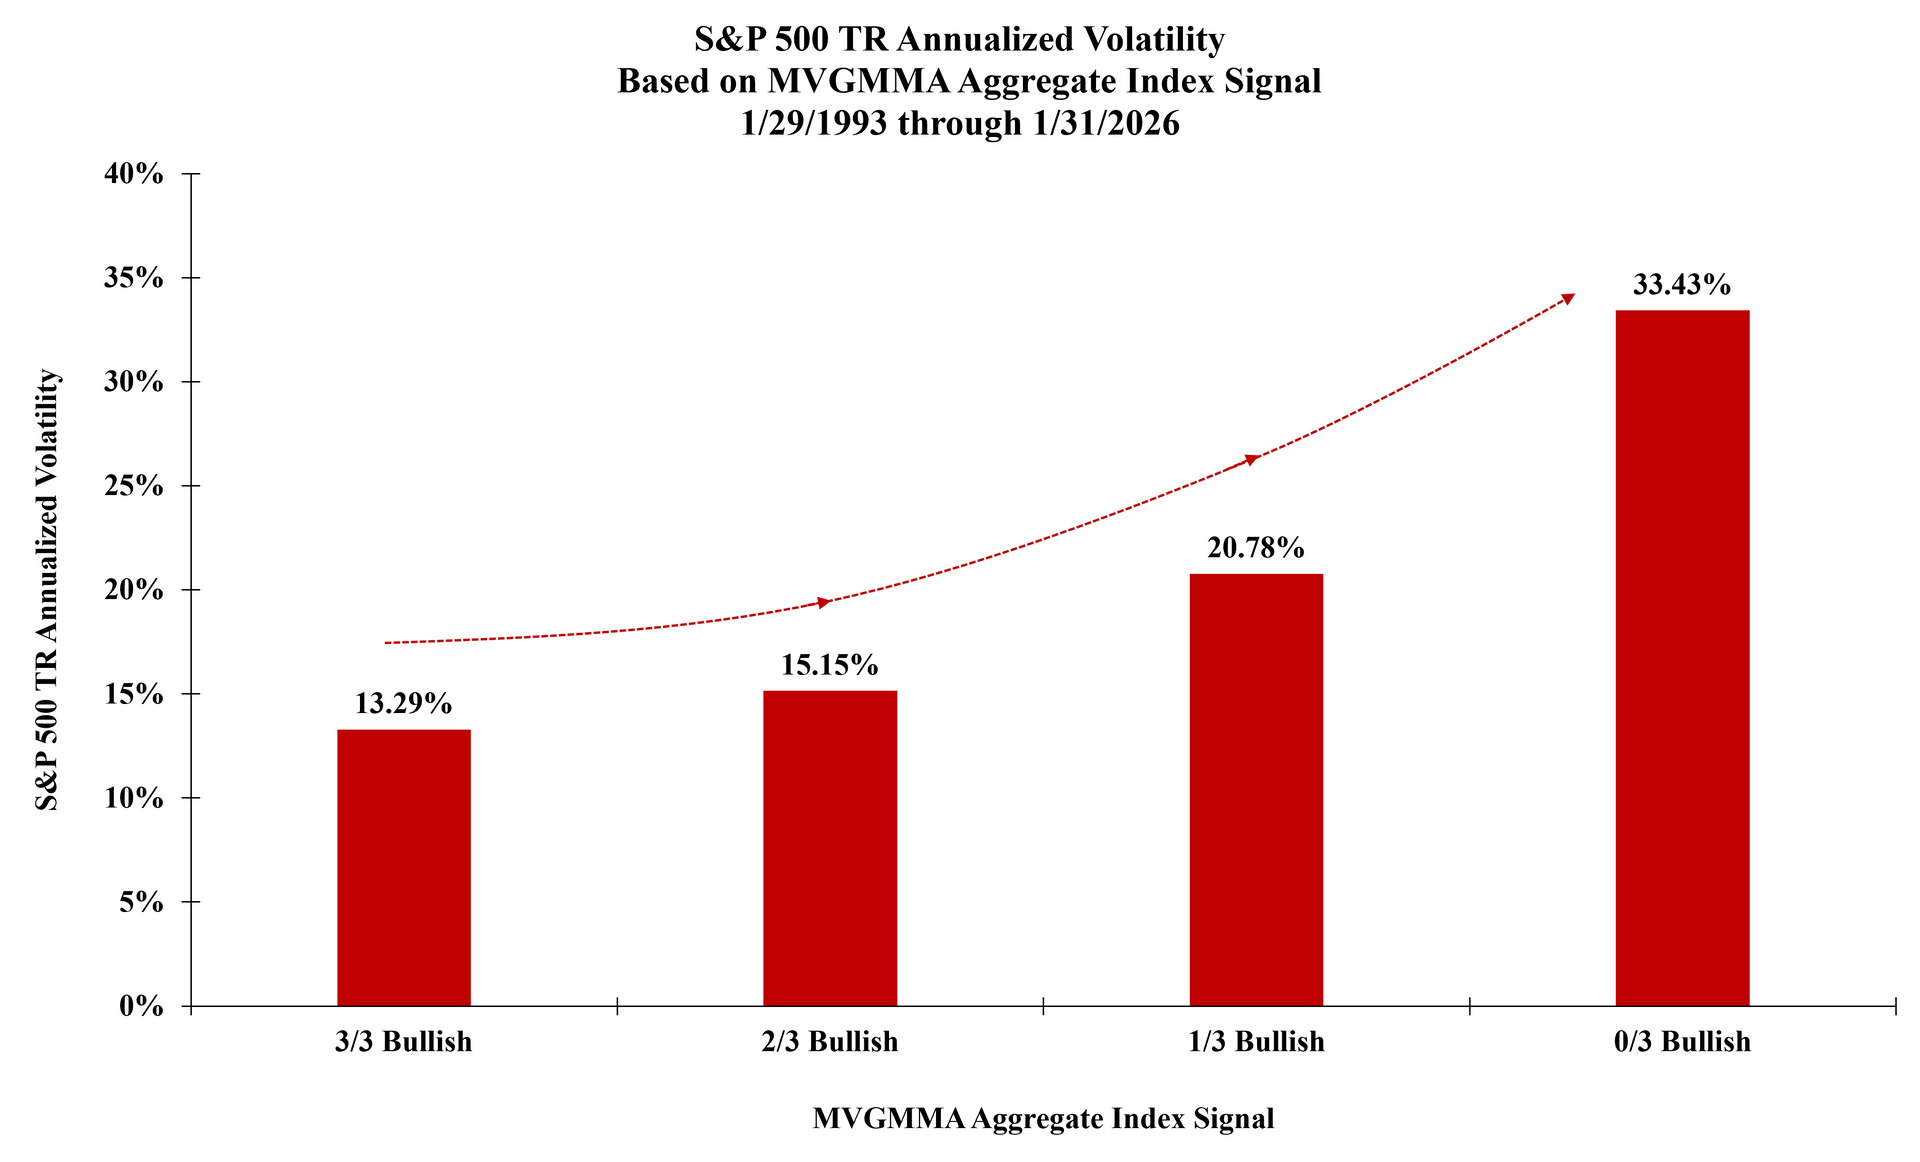
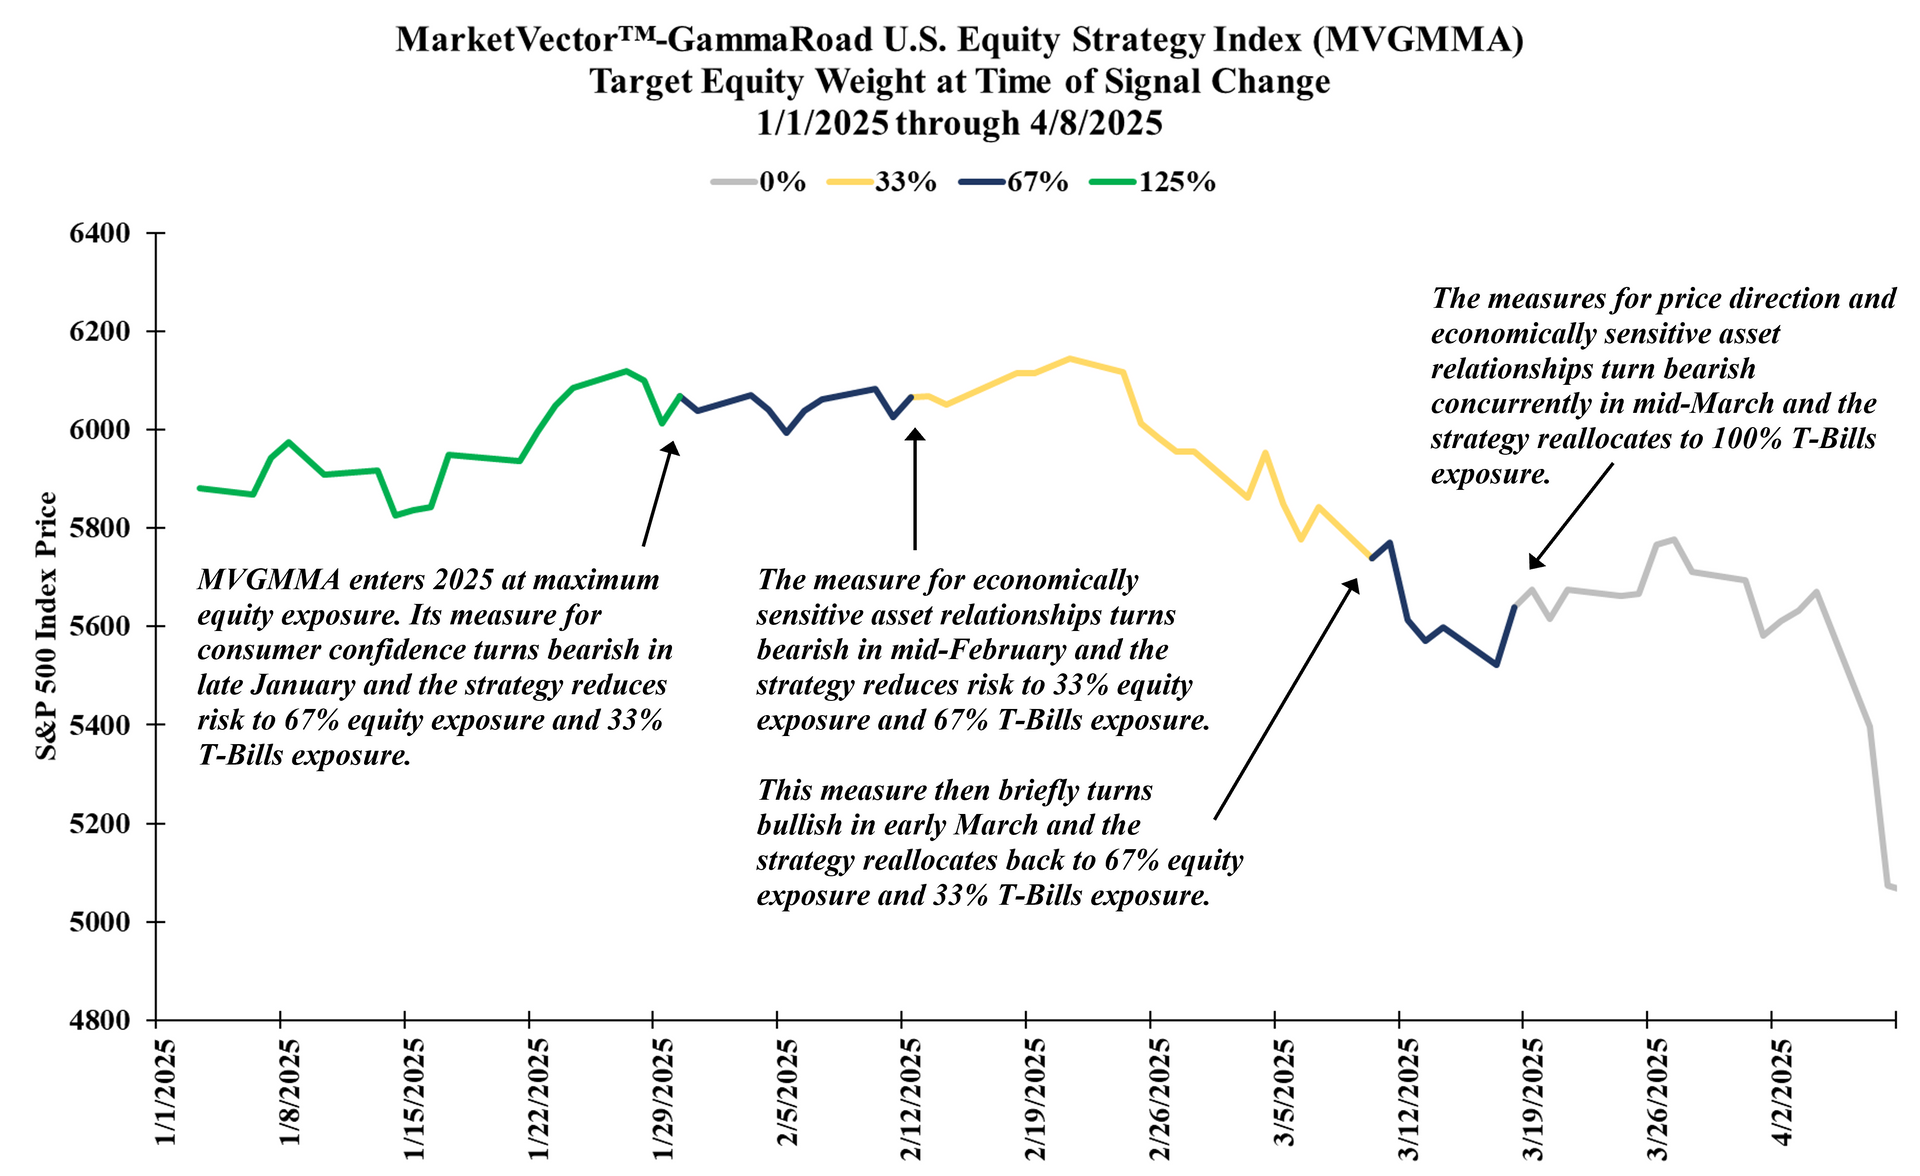
2025’s “Tariff Tantrum” presented the MarketVector™-GammaRoad U.S. Equity Strategy Index (Bloomberg: MVGMMA Index, “MVGMMA”) with its first live test of bear market conditions...
The equity market’s rally took a bit of a breather in December yet still delivered its eighth consecutive positive month on a total return basis. The S&P 500 Total Return Index...
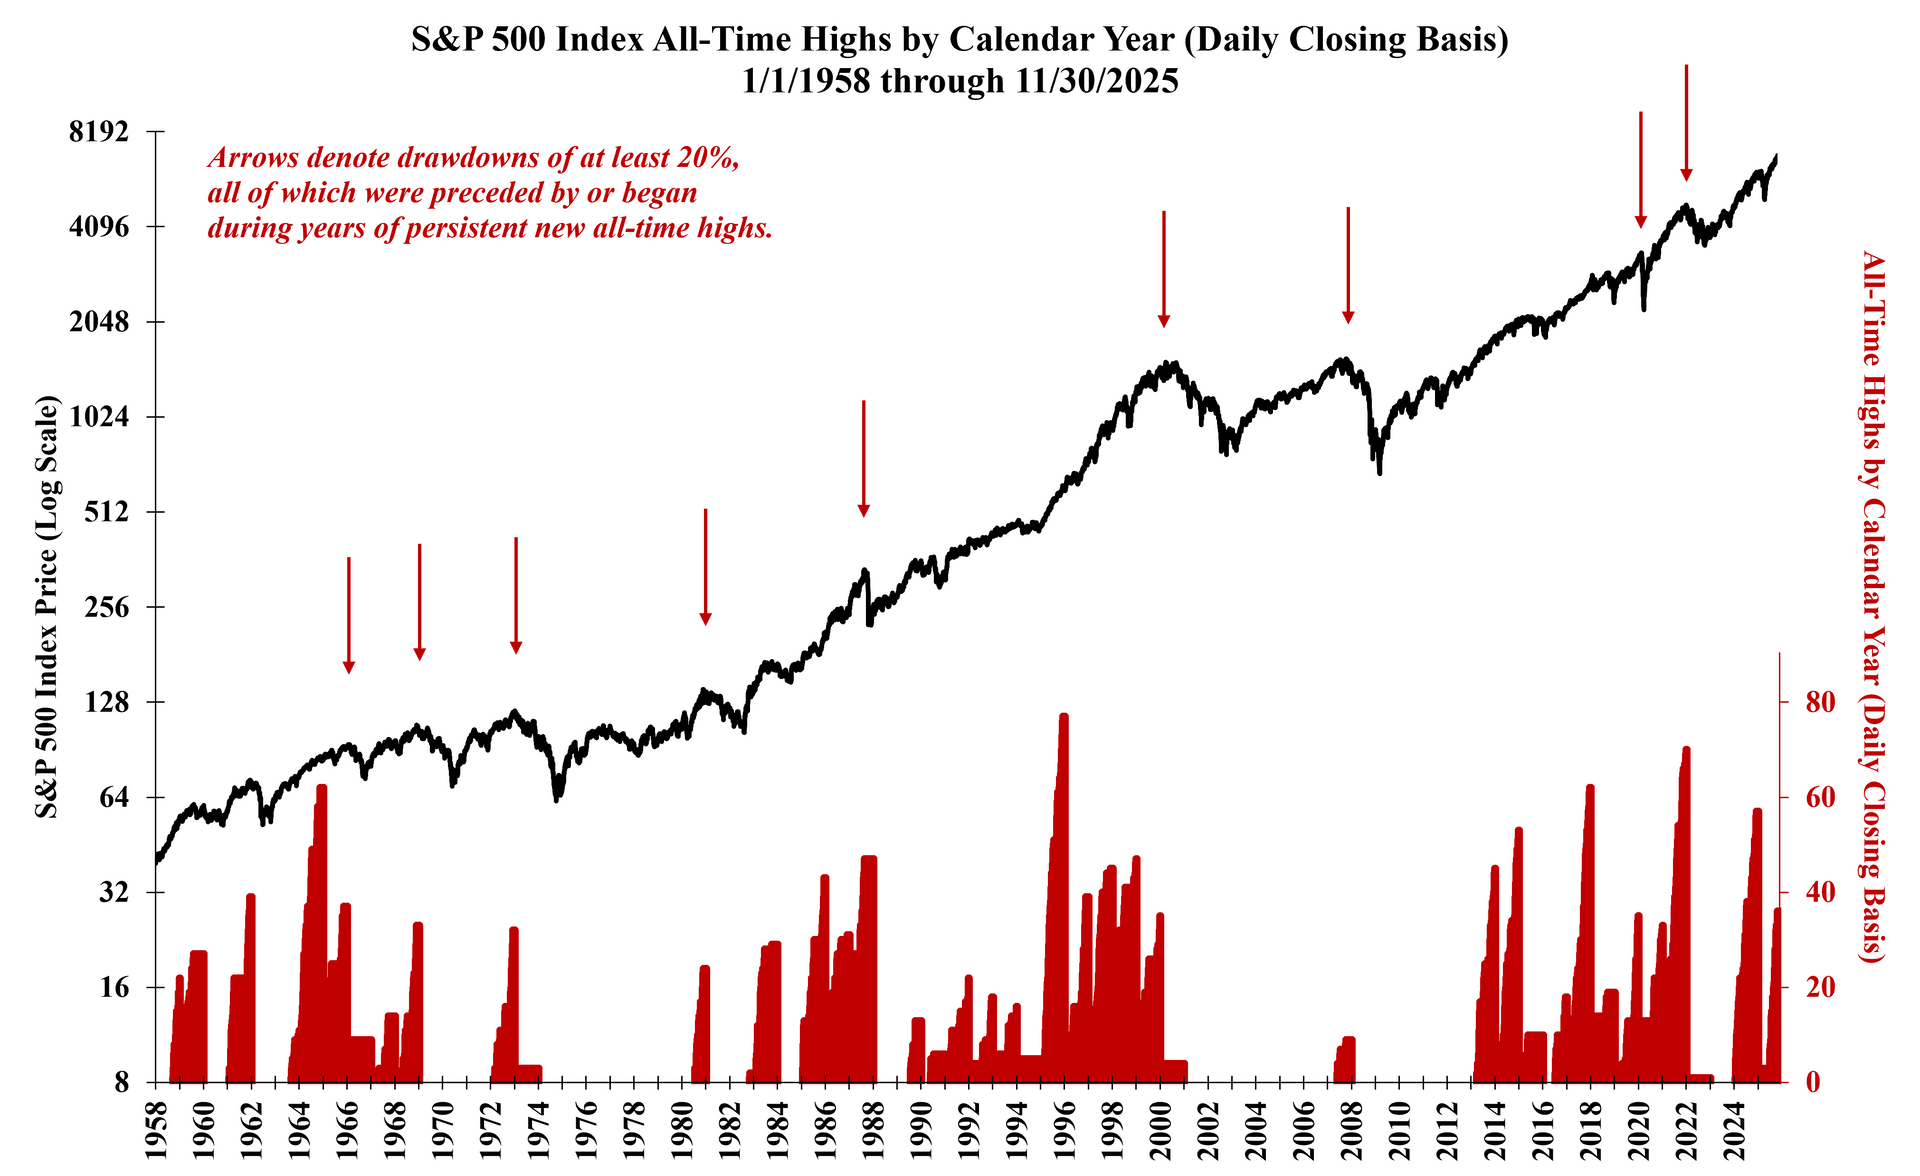
Last month we discussed the increasing prevalence of the “bubble” question. During November that chorus only grew louder, and was often accompanied by the refrain “Why worry when the market is at all-time highs?” This sounds like...
The equity market’s relentless march higher since its April low has given way to an increasing chorus of investors asking “Is this a bubble?” Indeed the market...