The equity market’s relentless march higher since its April low has given way to an increasing chorus of investors asking “Is this a bubble?” Indeed the market delivered another strong month to fuel this developing narrative, as the S&P 500 Total Return Index returned +2.34% for October and brought its year-to-date return to +17.52%. The MarketVector™-GammaRoad U.S. Equity Strategy Index (Bloomberg: MVGMMA Index) maintained its conservative positioning through the month and returned +1.04%, which raised its year-to-date return to +8.80%.
We would humbly suggest that the “bubble question”, while entertaining to discuss, is not the most helpful question to be asking now. At any point in any market cycle, we believe the only relevant question for an investor is “What is my plan, regardless of what the market might do from here?”
The current market environment and this growing “potential bubble” narrative more than ever exemplify the value of preparation by adhering to a rules-based process. The seemingly widespread fascination with constantly attempting to figure out the market’s next move is born from the natural human proclivity for storytelling, yet it provides no substitute for having a plan already in place before portfolio risk can be compounded by emotional interference.
Given this context, let’s review the path of our strategy’s three key measures of market risk this year, and what they are saying as of early November.
Consumer Confidence
The strategy’s measure for consumer confidence turned bearish in late January and is the only one of its three measures to remain bearish since. This contributed to the strategy’s successful avoidance of the violent tariff-driven drawdown earlier this year, and subsequently to the strategy’s mostly defensive positioning during the ensuing rally.
We have read some commentary in the past year suggesting that the relationship between consumer confidence and equity market risk has weakened significantly, as discretionary consumption has become marginally less influential for the domestic economy overall and therefore less influential for market risk. We do not consider consumer confidence to be a narrow, oversimplified barometer for discretionary consumption alone. Rather we view consumer confidence as the broader propensity for consumers to spend more or less, for business owners and managers to increase or decrease hiring, and for credit providers to increase or decrease lending. Our research process requires us to continually revisit the decades of evidence that support the use and construction of each of our strategy’s three risk measures. Based on this ongoing evaluation for consumer confidence, we do not see any evidence that the U.S. economy (nor its flow-through to the equity market) has made a structural shift away from its dependence on discretionary consumption, employment growth, or credit expansion.
This discussion also highlights our belief that developing and maintaining any edge in markets is often less about what you are measuring and more about how you are measuring it.
Economically Sensitive Asset Relationships
The strategy’s measure for economically sensitive asset relationships has reflected a mixed picture for most of the year regarding the robustness of the current economic expansion. As a reminder, the design of this measure intends to capture the tug-of-war between cyclically sensitive commodities, specifically copper and lumber, and a historically countercyclical commodity: gold. Most recently this measure turned bearish in early September and has remained bearish entering November.
We are cognizant that gold can be a controversial topic and is likely receiving a significant bid in recent years due to a confluence of macro and geopolitical factors that are beyond the scope of this update. However, we observe from market data spanning nearly six decades since the United States officially suspended the convertibility of the U.S. dollar into gold, that the price of gold has tended to show strength relative to cyclical assets during times of heightened risk aversion, economic weakness, and/or policy uncertainty. We view the relative price behavior between cyclically sensitive assets and gold as the degree to which markets are pricing in underlying economic expansion or contraction, which in turn exerts an intuitive influence on equity market risk.
We are also sympathetic to the view that the long-term financialization of the U.S. economy can certainly effect policy making, both monetary and fiscal. The chart below uses the Federal Reserve’s most recently published quarterly data to estimate the U.S. stock market’s total value relative to the size of the U.S. economy. While this relationship fluctuates meaningfully over time due to changes in economic growth and stock market performance, the total value of U.S. equities has clearly increased over time relative to the size of the economy:
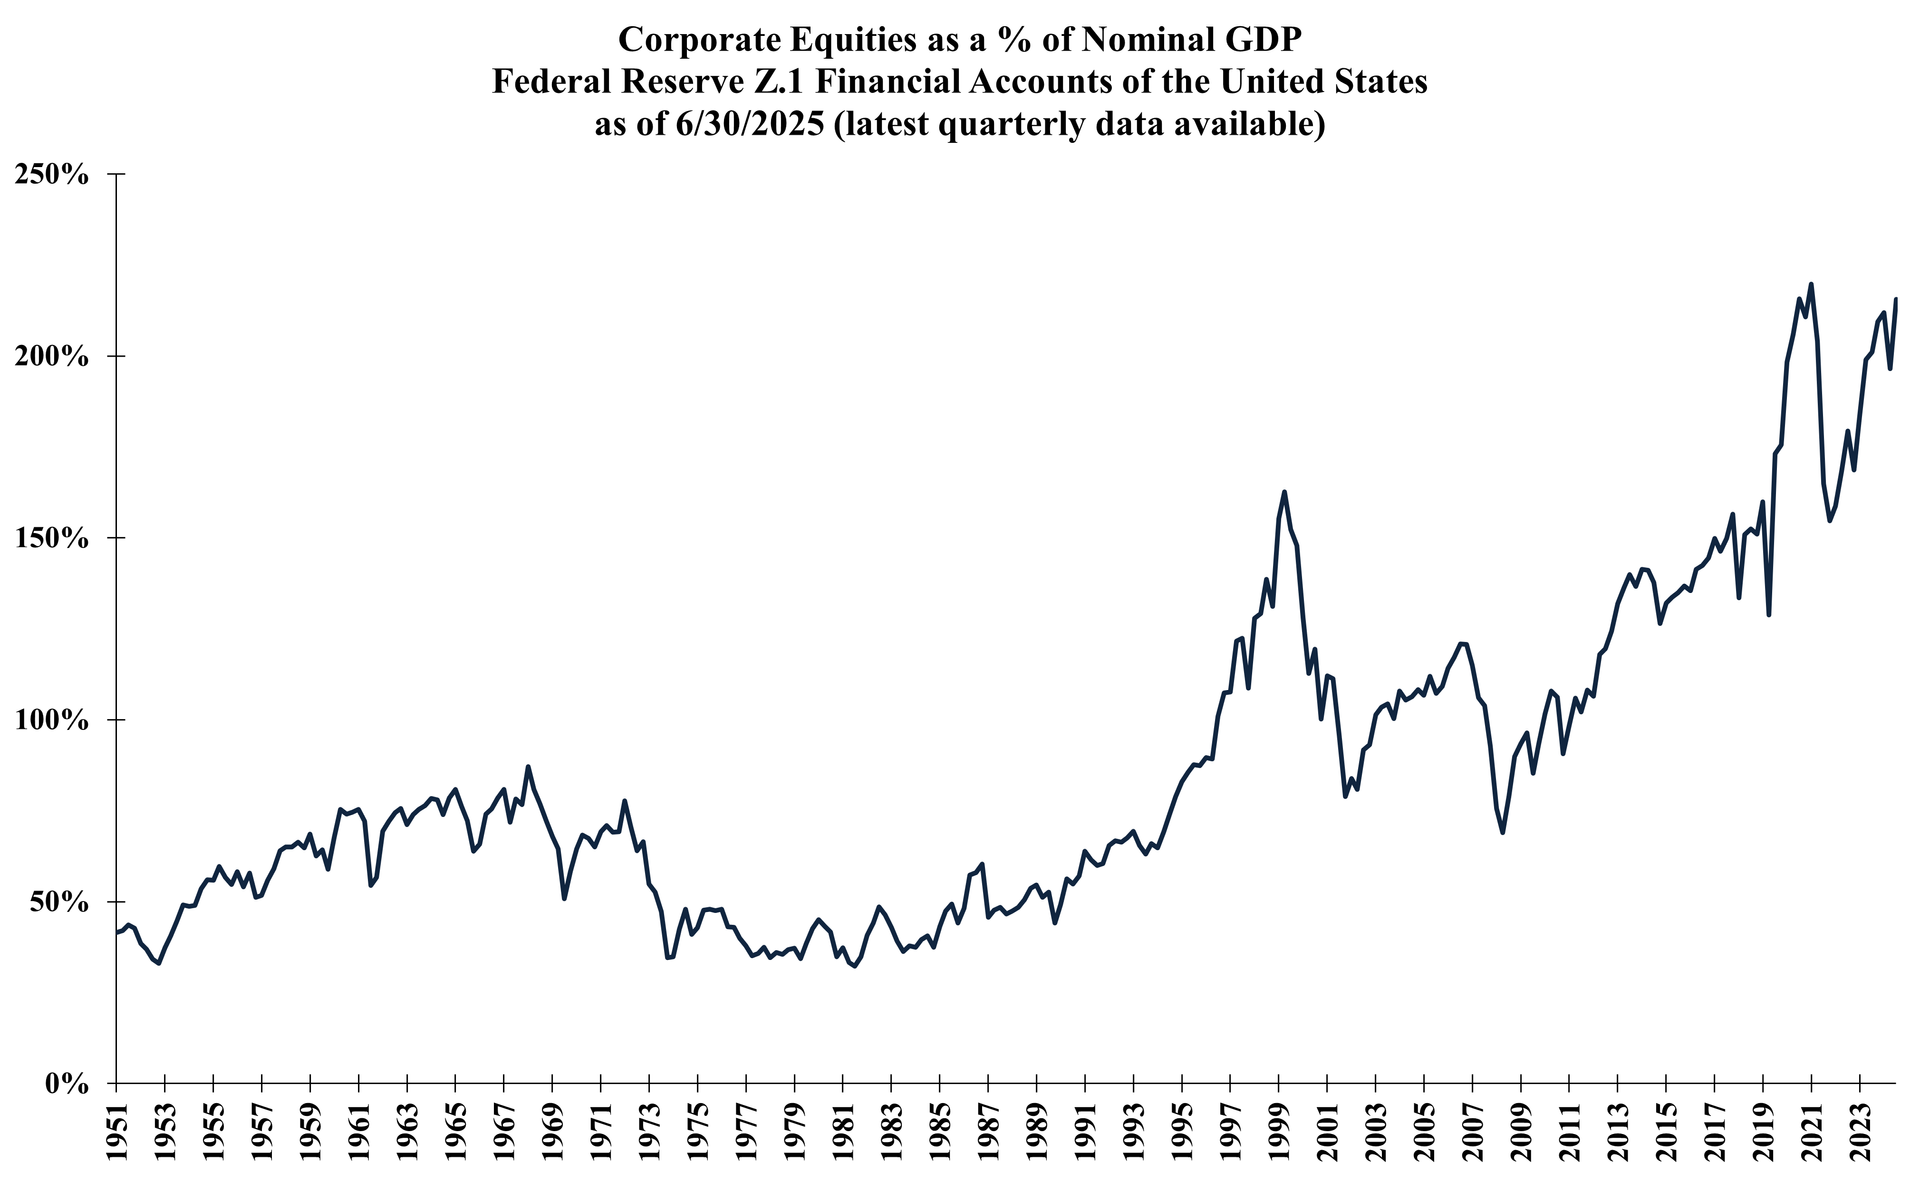
Source: Federal Reserve Bank of St. Louis, GammaRoad Capital Partners, LLC. Past performance is not indicative of future results. Please see the important disclosures that are integral to understanding the limitations applicable to the quantitative information in the presentation.
This increase in the market value of financial assets relative to economic output has led some market participants to propose that perhaps the tail now wags the dog, i.e. the performance of the stock market now drives economic direction at the margin. We agree that there is likely a behavioral reflexivity at play here, where the increase in financial asset values for those businesses and households with significant asset exposure experience heightened optimism and therefore a higher propensity to spend more, hire more, invest more, etc. Perhaps that reflexivity has been a larger driver in recent years and might even partially explain the recent disconnect between consumer confidence surveys and market performance addressed above. That said, the economy still matters for the markets and the animal spirits that drive price rallies and drawdowns. The strategy’s measure for economically sensitive asset relationships continues to suggest a condition of inconsistent economic durability despite the market’s positive performance this year.
Price Direction
The measure for the market’s overall trend has proven to be the strategy’s most influential driver in several ways this year. Price direction was the strategy’s final measure to turn bearish in mid-March and cause the strategy to reallocate to 100% T-Bills exposure in advance of the tariff tantrum. It was also the first measure to turn bullish once again and allow the strategy to participate in the rebound since the market’s trough in early April. Given the success that this measure has had in navigating the market’s major swings this year, why not overweight this measure or even use this exclusively as the sole allocation rule?
The answer is that we approach system design in the same way as we would approach strategic asset allocation for a multi-asset portfolio. This begins with the principle that we are seeking to combine as many sources of durable, repeatable edge that have as little overlap as possible. This is true in every possible dynamic of potential overlap, including the actual input data used, the fundamental rationale for why each measure should influence equity risk, the measurement method itself, and the time horizon over which each measure is calculated. From our perspective, time horizon diversification remains one of the more underutilized components of most investment processes we have evaluated.
Additionally, we always look to avoid dependency on any single measure or input to drive a strategy’s process and performance. We choose to equally weight the strategy’s three risk measures within the allocation framework because we embrace the reality that we cannot know which measure will outperform the others over the coming years. Much like any quantifiable element of markets, the efficacy of any individual measure will always be time-varying.
We enter November with the strategy maintaining its conservative equity exposure, as only one of its three key risk measures remains bullish. Regardless of whether “this is a bubble”, we find comfort in utilizing a rules-based process supported by objective measurement that continually weighs the evidence. If the market is approaching a significant inflection, the strategy is positioned and prepared to navigate the changing environment accordingly.
For a refresher on the strategy’s architecture and underlying process, please
watch our video here.
Important Disclosures
THIS PRESENTATION AND THE INFORMATION CONTAINED HEREIN WAS PREPARED BY GAMMAROAD CAPITAL PARTNERS, LLC (“GAMMAROAD”) AND IS SUBJECT TO AND QUALIFIED BY THE IMPORTANT DISCLOSURES BELOW.
Confidential
This presentation is directed solely to existing and potential users of the MarketVector™-GammaRoad U.S. Equity Strategy Index (Bloomberg: MVGMMA Index,
“MVGMMA Index”) and is furnished on a confidential basis only for the use of the recipient and only for discussion purposes. This presentation and its contents are proprietary information of GammaRoad and may not be reproduced or otherwise disseminated in whole or in part without GammaRoad’s prior written consent.
Not Advice or Recommendation
This presentation is neither advice nor a recommendation to enter into any transaction. This presentation is for information, illustration and discussion purposes only and is not intended as an offer to buy or sell, nor a solicitation of an offer to buy or sell, any security, commodity or other financial instrument. Nothing contained in this presentation is intended to represent the rendering of accounting, tax, legal, regulatory or investment advice by GammaRoad. While investors should understand and consider the risks associated with making an investment decision, this presentation should not be relied upon for that purpose and should not be a basis of any investment decision or retention of the MVGMMA Index. This presentation and the MVGMMA Index do not take into account the particular investment objectives, financial circumstances, restrictions, particular needs or financial, accounting, regulatory, legal or tax situation of any particular person, investor or type of investor. Neither GammaRoad nor its principals, officers, employees or associated funds or entities (all of the foregoing collectively, “Related Persons”) hereby makes any representation to any person or entity as to the suitability of the MVGMMA Index or any investments nor provide advice or recommendations regarding an investor’s decision to allocate funds based on the use of the MVGMMA Index or to maintain or sell investments based on the MVGMMA Index.
An investment decision by you to employ the MVGMMA Index in any capacity should be based on your independent judgment and customary and thorough due diligence procedures, including consultation with your own professional tax, legal and investment advisors. You should also inform yourself as to: (1) the legal requirements within your jurisdictions for the purchase, holding or disposal of investments; and (2) any income and other taxes which may apply to the purchase, holding and disposal of investments. Furthermore, you should keep in mind that any subsequent change in facts or circumstances could materially affect the accounting, tax, legal or regulatory treatment consequences of the MVGMMA Index and investments. Before you make any investment decisions based on the MVGMMA Index, you should determine whether the investment is suitable for you in light of your circumstances, investment objectives, financial situation and risk tolerance.
GammaRoad is not an Advisor or a Fiduciary
GammaRoad is not and does not purport to be an advisor as to legal, taxation, accounting, financial or regulatory matters in any jurisdiction. GammaRoad is not registered with any federal or state regulator and no fiduciary relationship under federal and/or state securities laws, the Commodity Exchange Act and/or ERISA is created by investing based on the MVGMMA Index, or through any communication with GammaRoad.
Limitation on Liability
No liability whatsoever is accepted for any loss (whether direct, indirect, or consequential) that may arise from any use of the information contained in or derived from this presentation or by use of the MVGMMA Index. In addition, GammaRoad, disclaims any and all liability as to the completeness or accuracy of the information contained herein and for any omissions of material facts. However, nothing herein shall in any way constitute a waiver or limitation of any rights available under applicable federal or state laws.
MVGMMA Index is Subject to Change
Please reference the MVGMMA Index Guide at www.marketvector.com/rulebooks/download/MVGMMA_Index_Guide.pdf for information regarding the development of the MVGMMA Index, its methodology and its risk management techniques.
Any changes to the Index Guide will be reviewed and approved by MarketVector Indexes (“MarketVector”) and MarketVector’s Legal and Compliance Department. MarketVector’s Legal and Compliance Department may also request a conclusive description and further information on any change and may consult MarketVector’s operations department on such changes. The key elements to be analyzed in this phase of the change process are robustness, transparency, reliability and integrity. The result of the review will be communicated to MarketVector’s operations department. The email will be archived by MarketVector’s operations department.
Changes that might immediately change the composition of the MVGMMA Index or must be considered material for any other reason also need to be approved by MarketVector’s Independent Oversight Function (“IOF”) prior to their publication and implementation.
In case of material changes an advance notice will be published and provided to users by MarketVector. MarketVector will generally disseminate a notification related to an Index Guide change 30 days prior to the change. A shorter period of time may be applied at MarketVector’s discretion if the relevant index has not been licensed for a financial product to a third party. The notice will describe a clear time frame that gives the opportunity to analyze and comment upon the impact of such proposed material change. Any material comments received in relation to the Index Guide change and MarketVector’s response to those comments will be made publicly accessible after any consultation, except where confidentiality has been requested by the originator of the comments.
Investment Performance
All performance information reflects the performance of the MarketVector™-GammaRoad U.S. Equity Strategy Index and does not reflect the trading of an actual account. The MVGMMA Index launched on December 22, 2023. Prior to December 22, 2023, all performance shown herein reflects backtested information based on the application of the MVGMMA Index methodology to the SPDR® S&P 500® ETF Trust (“SPY”) and the ProShares Ultra S&P500® (“SSO”) price and dividend data for the MVGMMA Index’s equity component during periods when the MVGMMA Index was not actually published. Prior to the inception of the SSO, the performance exhibits use twice the daily return of the SPY minus the daily equivalent of the SSO’s total expense ratio. For the non-equity component of the MVGMMA Index, the performance exhibits use the daily return and dividends for the SPDR® Bloomberg 1-3 Month T-Bill ETF (“BIL”). Prior to the inception of the BIL, the performance exhibits use a cash return that is the daily equivalent of the market yield on U.S. Treasury Securities at 3-Month Constant Maturity minus the daily equivalent of the BIL’s total expense ratio. The slides that show target equity weight changes apply the MVGMMA Index methodology to the S&P 500 Index price data during the periods shown. Both the S&P 500 TR and the S&P 500 Index (collectively the “S&P 500 Indices”) are indices comprised of the same 500 stocks chosen from all major industries based on market size, liquidity and industry grouping, among other factors. The difference between the S&P 500 TR and the S&P 500 Index is that the S&P 500 TR reflects the reinvestment of dividends while the S&P 500 Index does not. Investments cannot be made directly in broad-based securities indices. Therefore, the application of the MVGMMA Index methodology to the S&P 500 Indices is for illustration purposes only to demonstrate the efficacy of the MVGMMA Index methodology applied to these indices. January 29, 1993 was chosen as the base date for the MVGMMA Index so that the full research period would coincide with the inception of the SPDR® S&P 500® ETF Trust (“SPY”), which has the longest history amongst the largest and most liquid ETFs that passively track the S&P 500 Index. Additional information about the S&P 500 Indices and the U.S. Treasury Securities at 3-Month Constant Maturity is available from GammaRoad upon request.
The investment performance shown includes the reinvestment of dividends, interest and capital gains according to the MVGMMA Index and there was no withdrawal of cash during the performance period. In addition, you may pay brokerage commissions, exchange fees, and clearing fees to execute the MVGMMA Index methodology, none of which are subtracted in calculating the back-tested performance shown. Differences in the methodology used to calculate performance may also lead to different performance results than those shown. Annualized total return is computed on a compounded monthly basis. Volatility (standard deviation) and maximum drawdown percentage are computed on a daily basis. Beta and skew are computed on a monthly basis.
Back-tested performance is a type of hypothetical performance that cannot completely account for the impact of financial risk in actual management of a portfolio. In fact, there can be sharp differences between hypothetical performance results and the actual results subsequently achieved by any particular investment strategy due to many factors, some of which are described below. For example, the ability to withstand losses and adhere to the MVGMMA Index methodology in spite of trading losses is unknown and could have adversely affected actual results. Furthermore, back-tested performance results are prepared with the benefit of hindsight. This means that the MVGMMA Index has been formed in the present based in part on application of the MVGMMA Index methodology to the SPY, SSO, and BIL ETFs during the back-tested periods. The MVGMMA Index may have been constructed differently if GammaRoad did not have the benefit of its current hindsight and the MVGMMA Index may have performed significantly worse than the performance reflected herein. Furthermore, if the MVGMMA Index changes, the back-tested performance shown is not indicative of how the MVGMMA Index will perform if these changes occur. In addition, as noted above the back-tested performance shown does not subtract any brokerage commissions, exchange fees, and clearing fees. For the foregoing reasons and for numerous other reasons related to the markets, no representation is made that any investor using the MVGMMA Index will or is likely to achieve profits or losses similar to those shown.
Performance may vary substantially from year to year or even from month to month. Differences in the timing of transactions and market conditions prevailing at the time of investment may lead to different results. The value of investments can go down as well as up. Past performance is not indicative of future results and GammaRoad makes no representation that any user of the MVGMMA Index will or is likely to achieve profits or losses similar to those shown herein.
Benchmark Comparison
The performance shown is compared to the S&P 500 TR. The comparisons to the S&P 500 TR are included merely to show the general performance in the market in the periods indicated and is not intended to imply that the MVGMMA Index is similar to the S&P 500 TR in either composition or element of risk. Investments cannot be made directly in a broad-based securities index.
Risk of Loss and Other Risks
Investing in securities entails certain risks, including the possible loss of the entire principal amount invested. Volatility and returns depend on a variety of factors including overall market conditions, and unpredictable economic and political events.
All projections, valuations, and statistical analyses are provided to assist the recipient in the evaluation of the matters described herein. Such projections, valuations and analyses may be based on subjective assessments and assumptions and may use one among many alternative methodologies that produce different results; accordingly, such projections, valuations and statistical analyses should not be viewed as facts and should not be relied upon as an accurate prediction of future events.
Investments pursuant to the MVGMMA Index may be exposed to risks relating to non-U.S. markets, including, without limitation, risks relating to currency exchange, tax, lack of liquidity, market manipulation, political instability and higher transaction costs.
No representation is made that the MVGMMA Index's investment processes, investment objectives, goals or risk management techniques will or are likely to be achieved or successful, or that the MVGMMA Index methodology and/or any investment will make any profit or will not sustain losses. The MVGMMA Index may not be suitable for everyone.
Conflicts of Interest
GammaRoad’s Related Persons may invest personal assets pursuant to the MVGMMA Index methodology. To address potential conflicts of interest with the investing of users of the MVGMMA Index, GammaRoad has instituted an internal Personal Trading Policy with which all Related Persons are required to comply. With respect to each GammaRoad strategy, GammaRoad’s Personal Trading Policy seeks to allow users to have the opportunity to trade before and at better prices than Related Persons. A copy of GammaRoad’s Personal Trading Policy is available upon request.
Limitations on Information Contained Herein
This presentation is based on information including, but not limited to third-party benchmark information, that has been obtained from sources that GammaRoad believes to be reliable; however, such information has not been independently verified. GammaRoad (i) makes no representation as to, and accepts no responsibility or liability for, the accuracy, truthfulness or completeness of the information; (ii) and does not represent it as accurate, true or complete; (iii) makes no warranty, express or implied regarding it; and (iv) shall not be liable for any losses, damages, costs or expenses relating to its adequacy, accuracy, truth, completeness or use unless the waiver of such liability constitutes the waiver of any rights you may have under applicable federal or state laws.
The information in this presentation is current as of the date indicated and is subject to change or amendment. The delivery of this presentation at any time does not imply that the information contained herein is correct at any time subsequent to such date. GammaRoad undertakes no responsibility or obligation to revise or update this presentation and/or the opinions, statements, assumptions, analyses, assessments, projections, forward looking statements, similar statements and other views expressed in this presentation (collectively, the “Statements”). All Statements constitute only subjective views of GammaRoad, should not be relied on, and are subject to change without notice due to many factors, including fluctuating market conditions, and economic factors.