The market churned its way through a choppy September as the S&P 500 Total Return Index returned -0.35% for the month, which brought its year-to-date return to +12.75%. The MarketVector™-GammaRoad U.S. Equity Strategy Index (Bloomberg: MVGMMA Index) once again maintained its positioning throughout the month and returned -0.14% in September, which brought its year-to-date return to +5.59%.
The persistent rise in interest rates seemed to dominate the daily market headlines throughout September, and understandably so. The 10-year Treasury yield rose 54 basis points to 5.29%. This marked the largest monthly rise since September 2022, and the highest monthly close since March 2002.
What does this mean, if anything, for the equity market? The last 70 years of market evidence demonstrate that the prevailing trend in long-term interest rates clearly matters to long-term equity returns. We recently shared our analysis of this evidence in our June update.
To consider how this historical evidence applies to the current environment, we find it helpful to understand how rising rates can impact equity returns. We see three primary channels through which rising rates increasingly represent a headwind to the current equity bull market.
Discounting the Present Value of Future Cash Flows
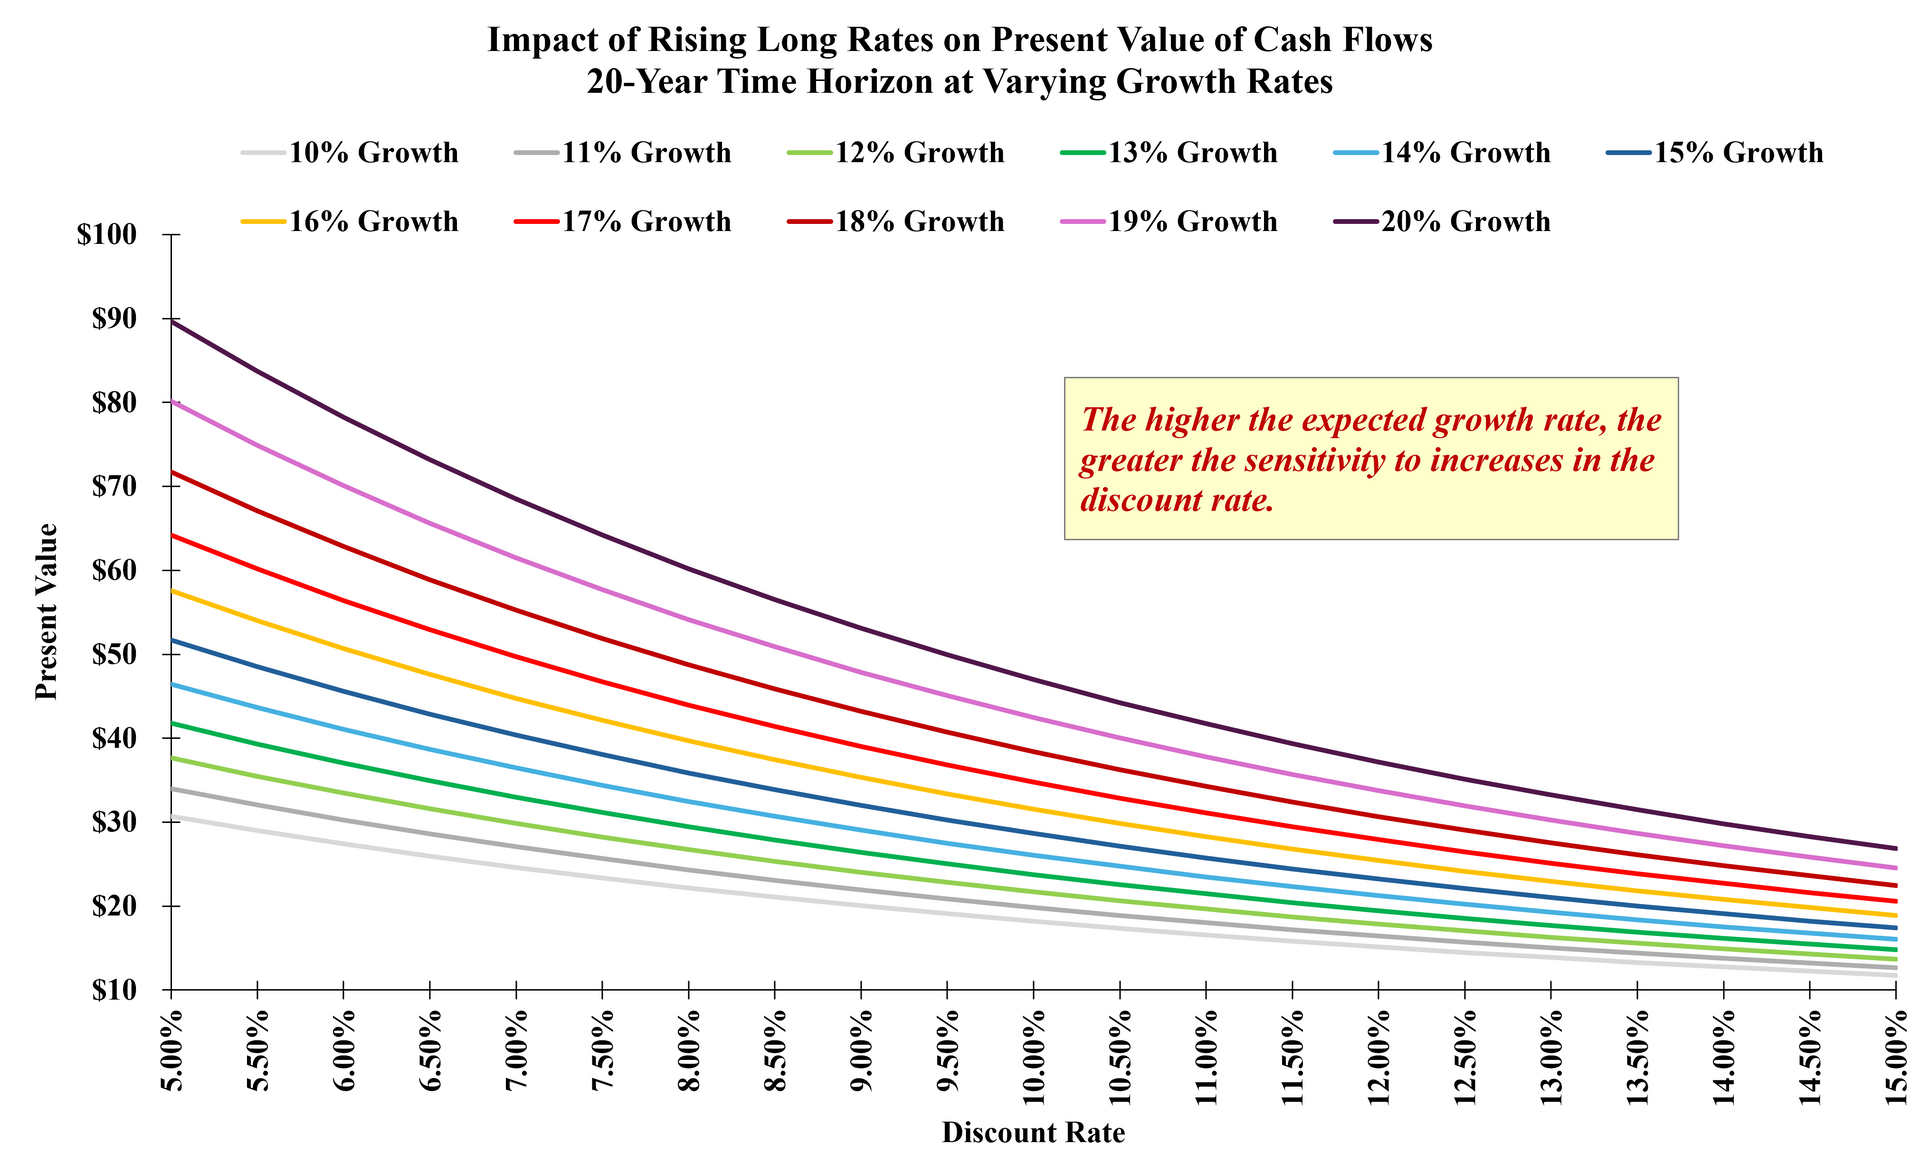
Let’s assume a hypothetical company is expected to achieve a constant growth rate in cash flows over a 20-year time horizon. Each line on the following chart corresponds to a different growth rate. The chart illustrates how the present value of cash flows changes as the discount rate rises.
Here we see that the higher the expected growth rate, the greater the sensitivity to increases in the discount rate:
Source: GammaRoad Capital Partners, LLC. Please see the important disclosures that are integral to understanding the limitations applicable to the quantitative information in the presentation.
Let’s use the minimum and maximum growth rate lines to better understand this discounting property. We can observe that as the discount rate increases (i.e. as we move from left to right on the chart), the slope of the 20% growth line (top line, dark purple) remains much steeper than the slope of the 10% growth line (bottom line, light gray). Another way to think about this is that regardless of the absolute discount rate, any increase in that discount rate has a larger adverse impact on higher growth cash flows.
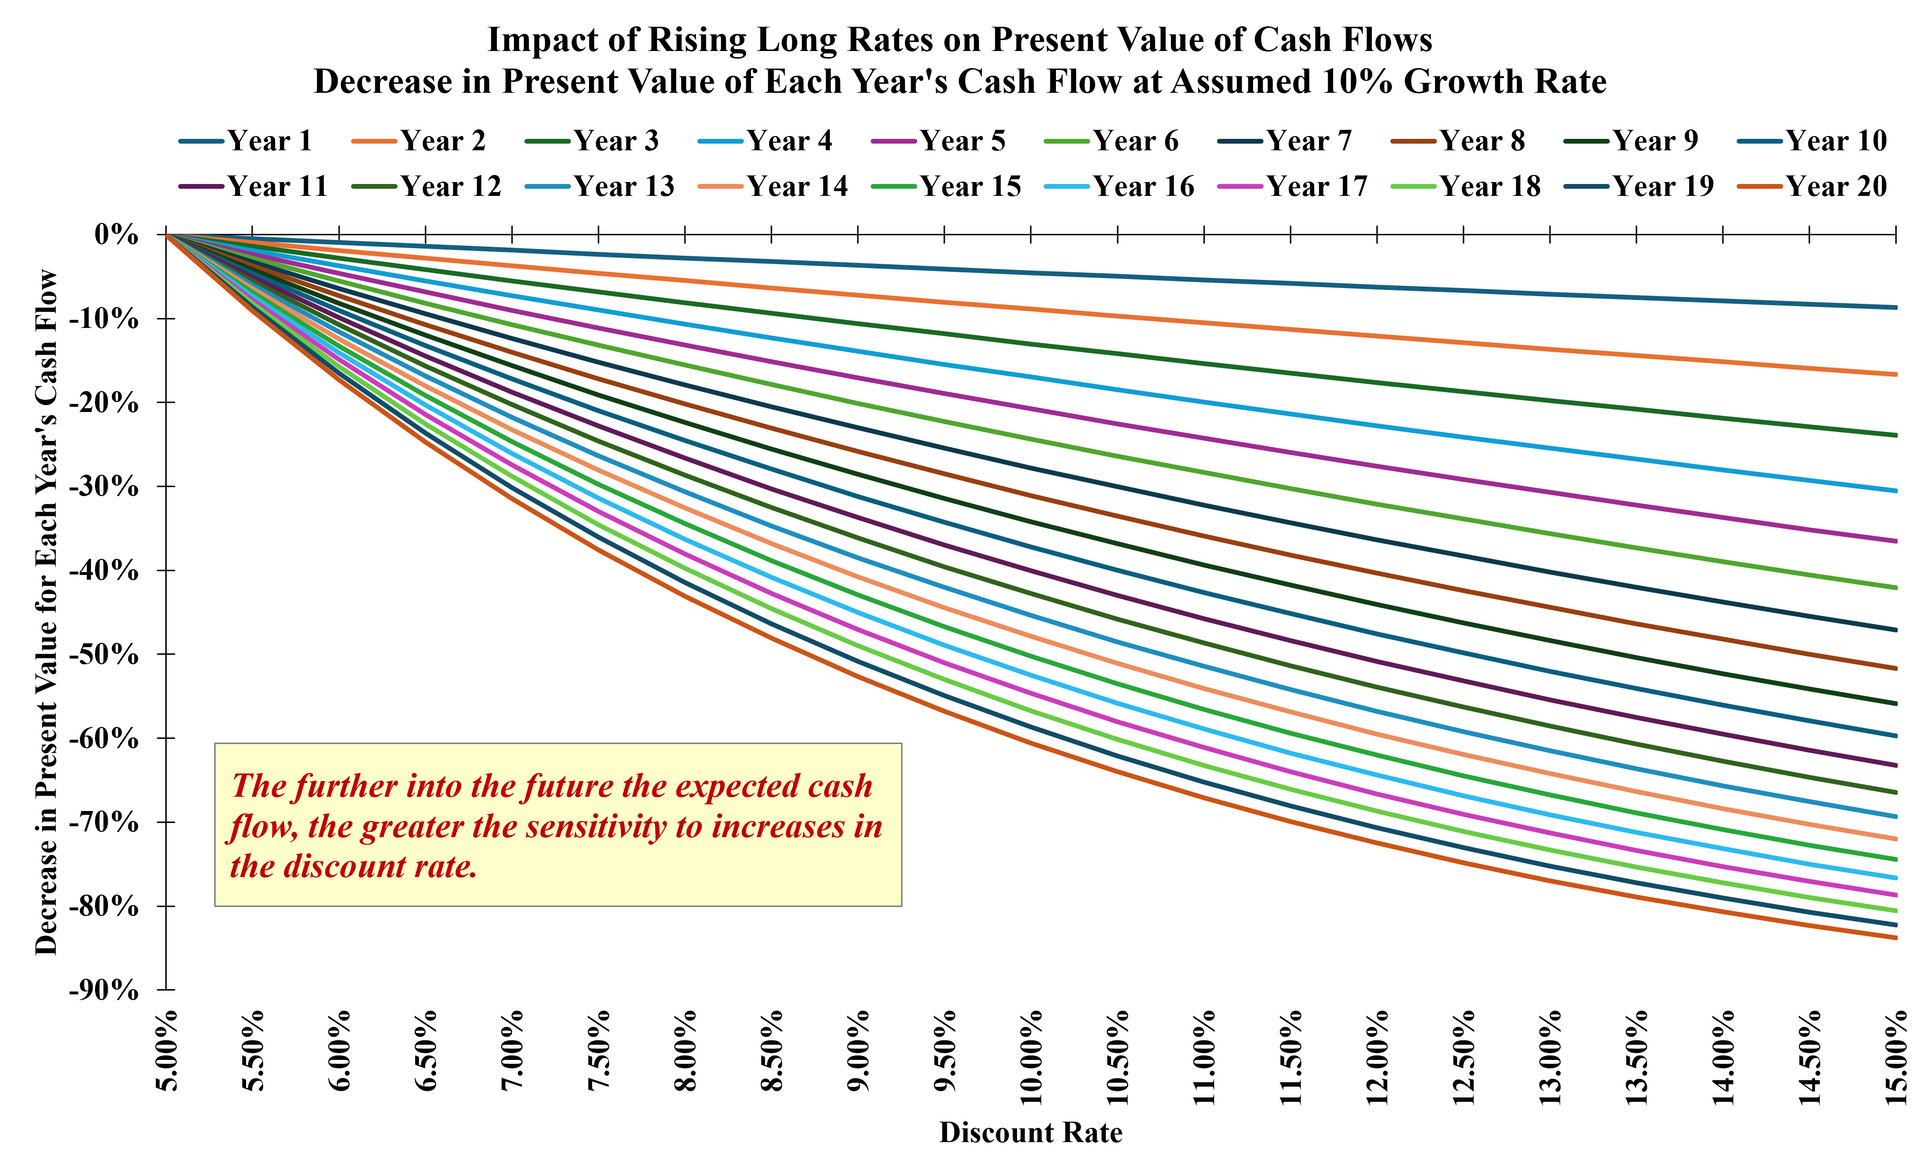
The next chart illustrates the second relevant property of the discounting impact. Let’s assume our hypothetical company is expected to earn a constant 10% growth rate over the 20-year horizon. We can examine how the present value of each individual year’s cash flow is impacted as the discount rate rises.
We see below that the further into the future the expected cash flow, the greater the sensitivity to increases in the discount rate:
Source: GammaRoad Capital Partners, LLC. Please see the important disclosures that are integral to understanding the limitations applicable to the quantitative information in the presentation.
We can observe in the chart above that while the Year 1 cash flow’s present value only decreases marginally at higher rates (top line, dark blue), the Year 20 cash flow’s present value decreases enormously at higher rates (bottom line, dark orange).
If this seems academic, consider that the dominant driver of the current bull market is the expectation of exceptional future cash flow growth enabled by an AI-powered economy. The greatest sources of uncertainty underpinning this narrative are the actual growth rates that will be achieved and the time required to achieve them.
The two charts above show that the higher the assumed growth rate, the more severe the discounting impact, particularly for cash flows that are expected furthest out from today. This is the exact profile of the high-growth tech businesses that currently dominate equity benchmarks and venture capital portfolios.
The mounting opposition to data centers across the country threatens meaningful political (and therefore timing) obstacles to the AI infrastructure buildout, while safety concerns have come front and center in the national headlines. Any slowdown in development defers the time when actual cash flow growth can have a chance to deliver on the currently lofty expectations.
Refinancing Risk
As the pandemic unfolded during March 2020, the Federal Reserve cut the policy rate by a massive 150 basis points that month. The 10-year Treasury rate bottomed at its lowest daily close in the last 7 decades that same month and saw its lowest monthly close over that same period in July 2020. Over the ensuing months corporate bond spreads compressed meaningfully as markets responded favorably to monetary and fiscal stimulus. The result was that companies were then able to borrow at historically low rates during late 2020 and throughout 2021.
This matters today particularly for corporations that borrow at high yield rates. High yield bonds typically carry a maturity of between 5 to 10 years, and the issuing companies often begin looking to refinance their debt 12 to 18 months in advance of maturity. The continued rise in rates and the developing rise in spreads mean that these companies are entering a period when they will need to refinance their 2020-2021 debt issuance at an interest rate several hundred basis points higher.
What was once free cash flow for these companies is now becoming interest expense.
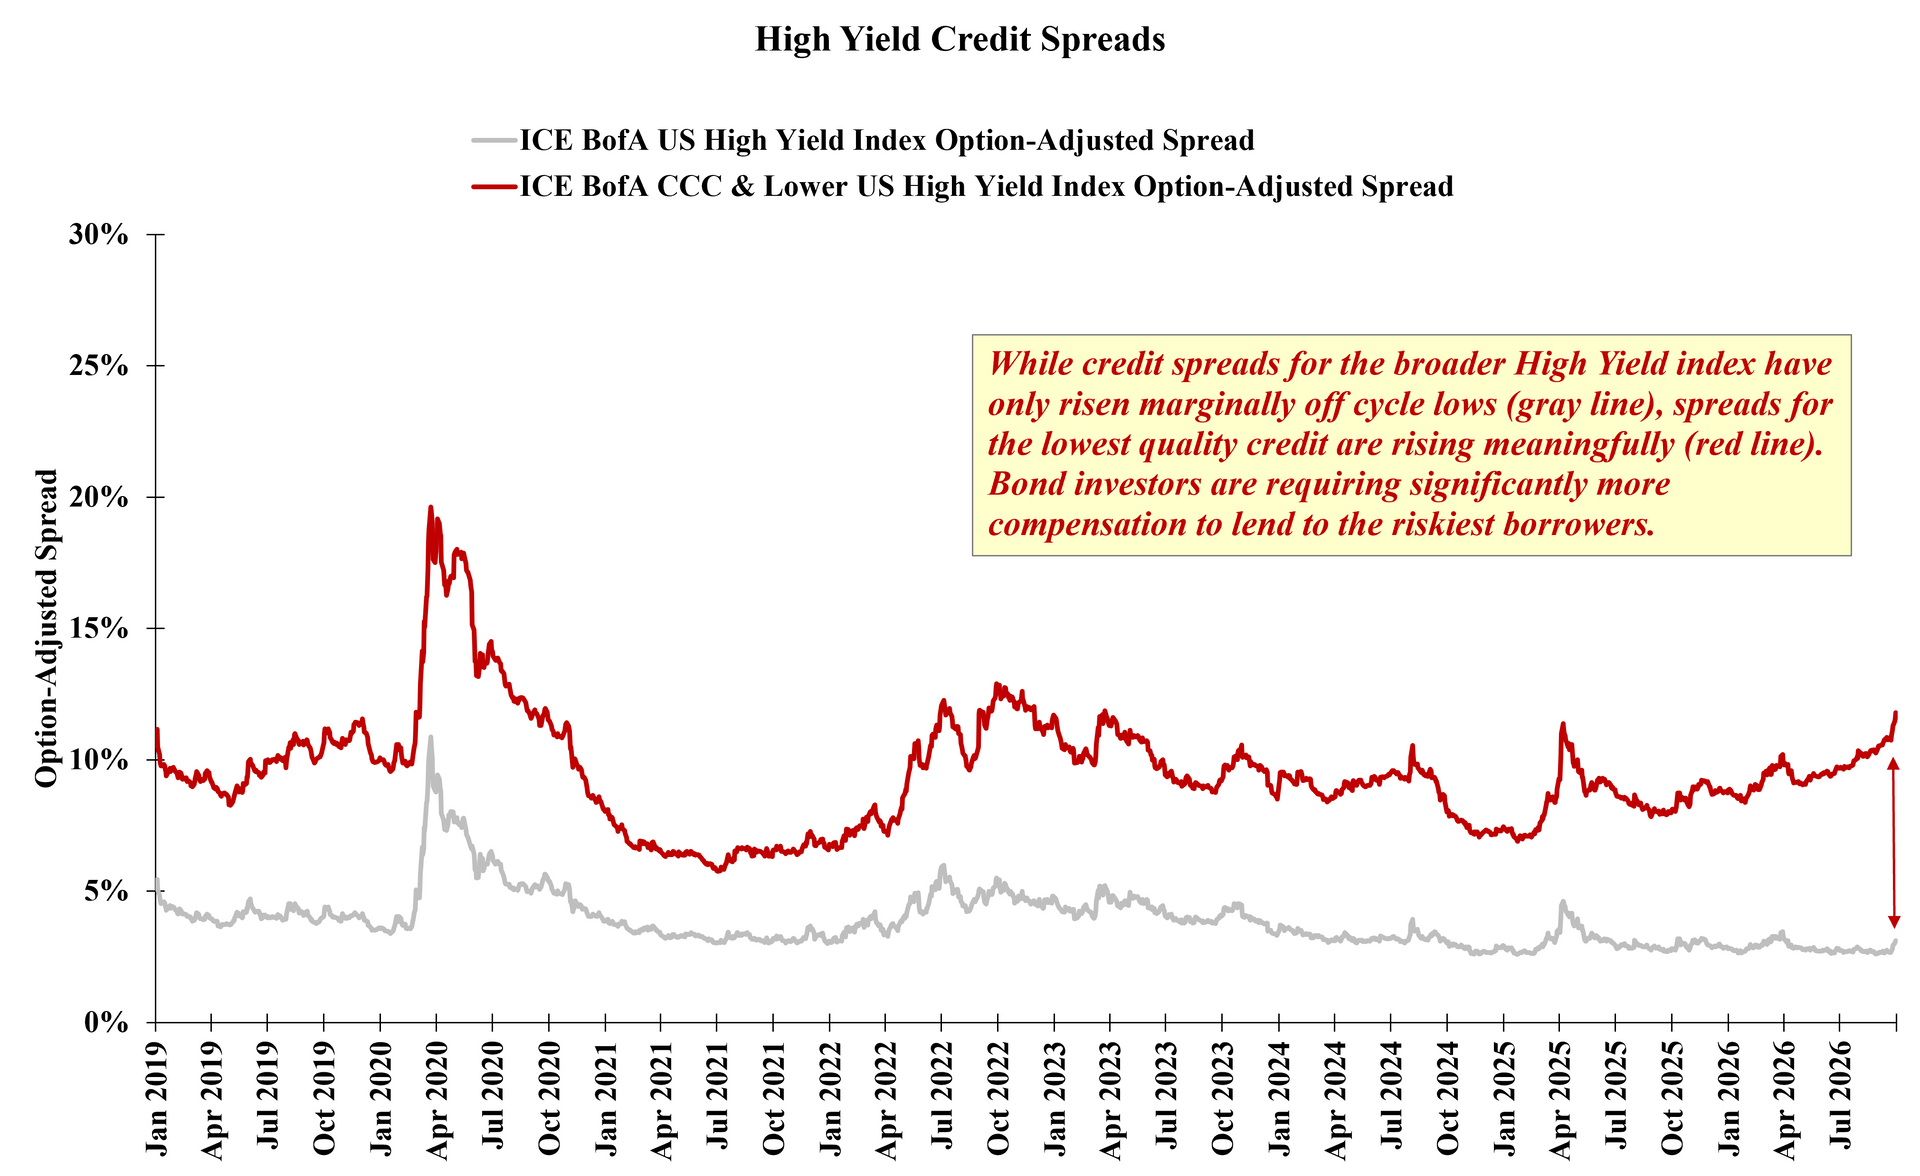
The following chart illustrates the recent rise in high yield spreads for the riskiest borrowers (rated CCC and lower) versus the broader index:
Source: Federal Reserve Bank of St. Louis, GammaRoad Capital Partners, LLC. Past performance is not indicative of future results. Please see the important disclosures that are integral to understanding the limitations applicable to the quantitative information in the presentation.
Rising spreads in the riskiest cohort of high yield borrowers parallels private credit’s recent struggles, which appear to be gaining steam rather than dissipating. Since we first addressed this issue in our March update, the last several months have brought reports that defaults at the largest publicly traded private credit funds continue to rise, while nonaccruals are also rising (meaning borrowers have failed to make scheduled payments for at least 90 days, causing the lender to change how they account for the loan).
This comes while many private credit funds have capped quarterly redemptions this year at 5% of NAV, while investors’ redemption requests have been consistently reported in the mid-teens. This means that these investors might only be receiving one-third to one-half of the total liquidity they requested, and they will likely submit additional redemption requests into 2027. The dynamic of investors’ demanding greater liquidity while the underlying creditworthiness is deteriorating does not provide a recipe for smooth sailing.
Competition for Asset Allocation
As the 10-year Treasury rate rises, the absolute and risk-adjusted expected performance comparison to equities becomes increasingly attractive, particularly for large pension funds, insurance companies and retirees.
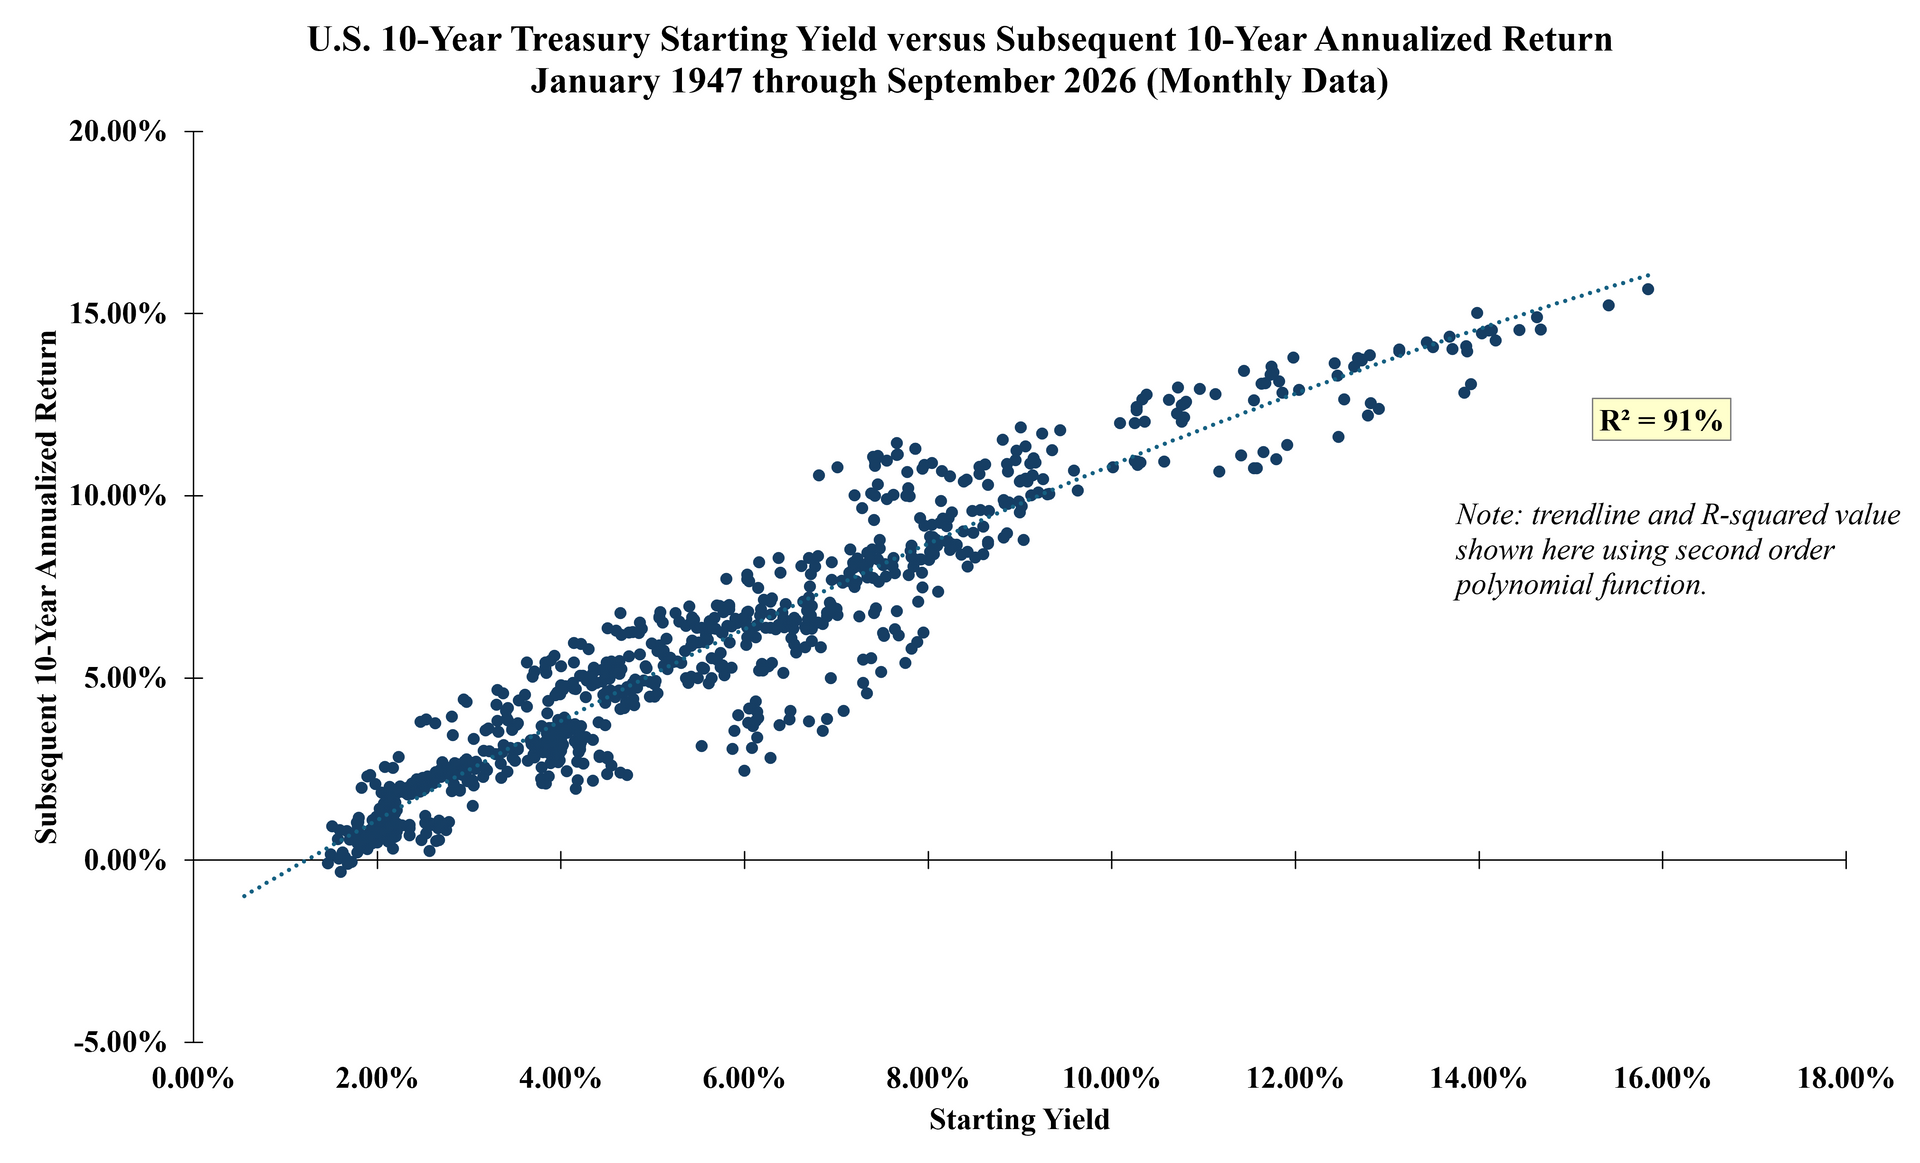
Unless an investor expects the U.S. to default on its debt obligations (in which case, owning any cash flow generating asset will likely be painful), the 10-Year Treasury offers a uniquely higher degree of certainty for holding through maturity relative to other assets. The following chart shows how the starting yield for a 10-Year Treasury has historically provided a firm expectation for the annualized total return over the subsequent 10 years:
Source: Swinkels, L. (2023) Data: International Government Bond Returns Since 1947. figshare. Dataset. https://doi.org/10.25397/eur.8152748., Federal Reserve Bank of St. Louis, GammaRoad Capital Partners, LLC. Past performance is not indicative of future results. Please see the important disclosures that are integral to understanding the limitations applicable to the quantitative information in the presentation.
The R-squared value at 91% suggests an unusually high degree of the starting yield’s explanatory power for subsequent annualized return. We have not come across any model or similarly simple relationship that can estimate forward 10-year annualized returns for equities with anywhere near this effectiveness. While extensive research has been published on long-term valuation measures and other multivariate models, we have found that these approaches (at best) provide some evidence of an inverse relationship between valuation and subsequent equity returns, but come with a much wider band of uncertainty.
The 10-Year U.S. Treasury rate closed September at 5.29% While conventional long-term expectations for equity returns often hover around 7% to 10% annualized, a quick review of the capital markets assumptions published by many of the larger investment managers earlier this year shows consensus expectations much closer to the 10-Year. Long-term return expectations for these two assets are converging as rates continue their ascent.
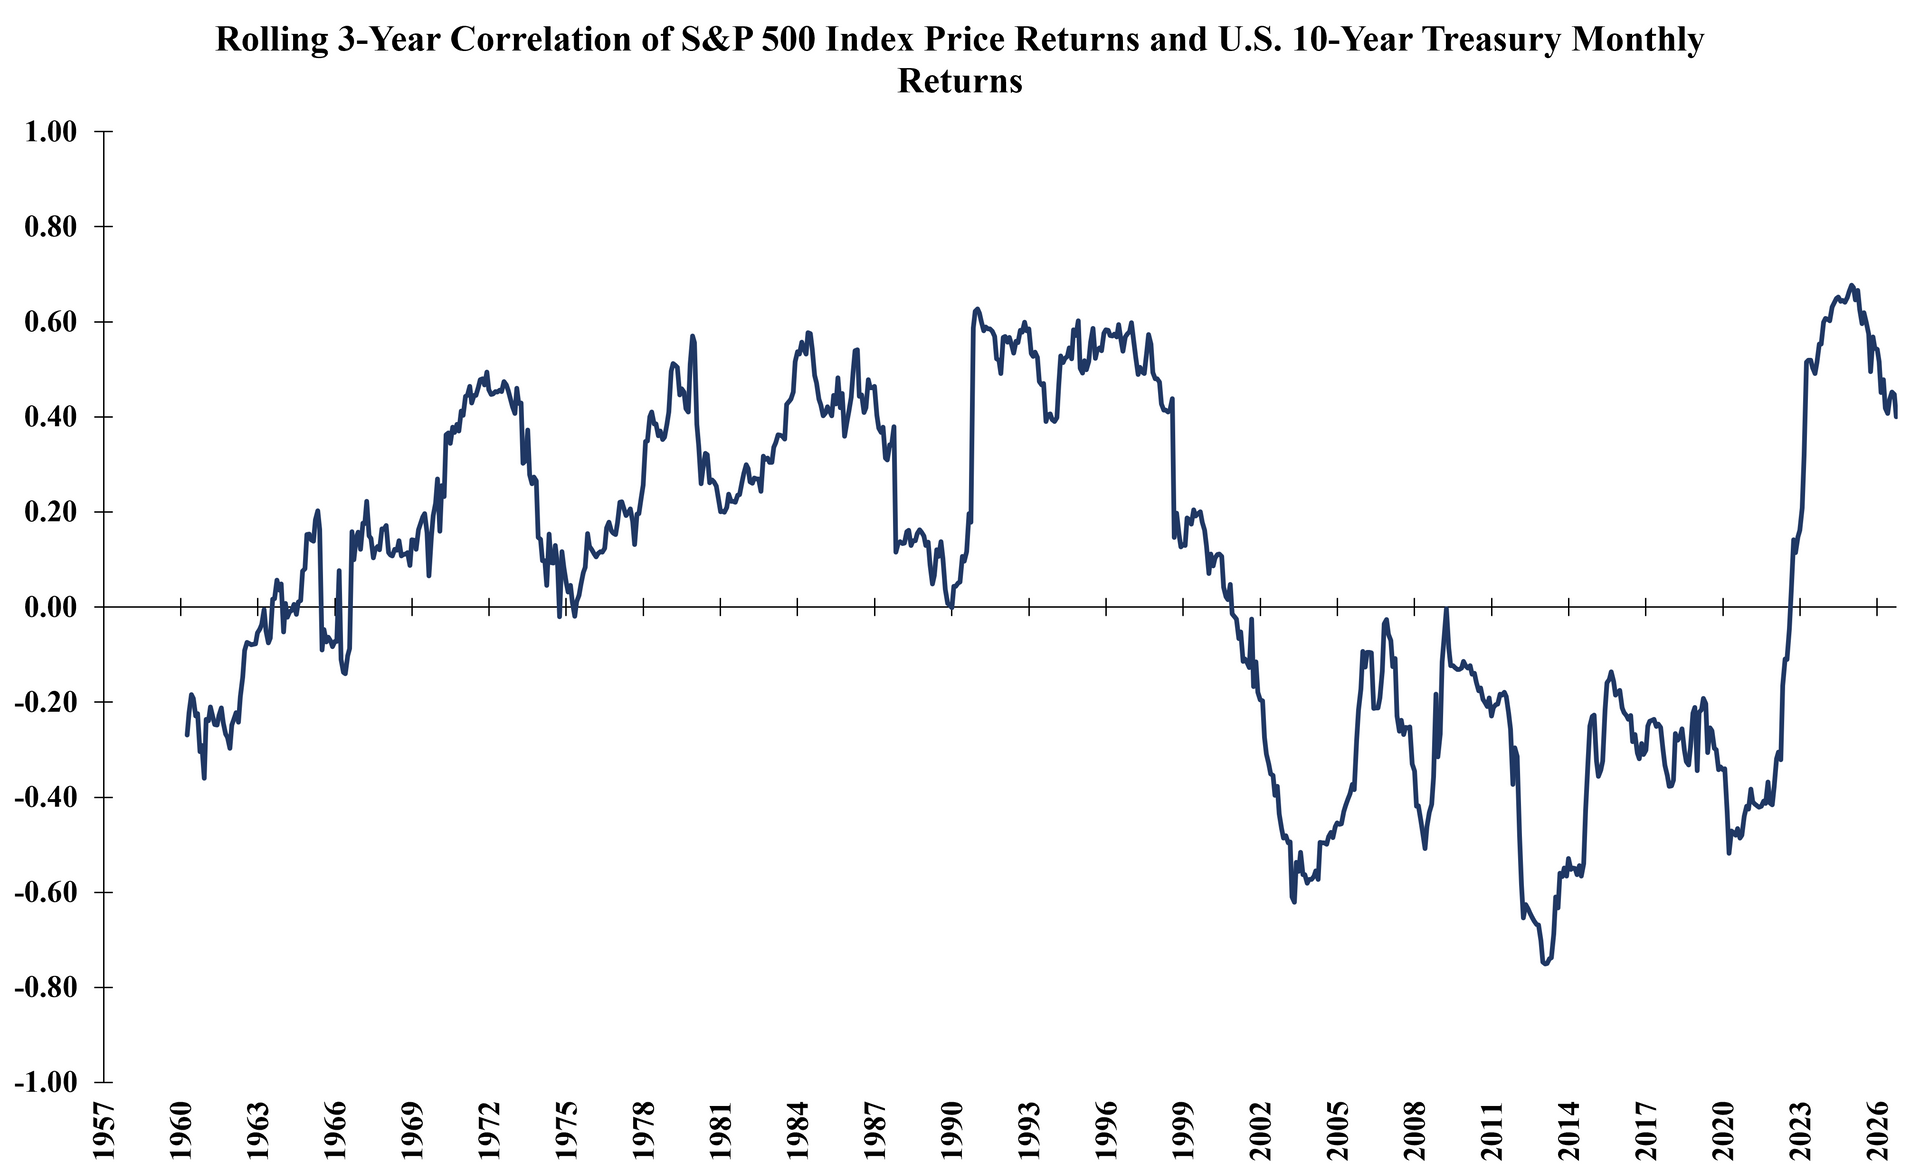
The current market environment is also characterized by a positive correlation between equities and Treasuries, as shown in the following chart:
Source: Swinkels, L. (2023) Data: International Government Bond Returns Since 1947. figshare. Dataset. https://doi.org/10.25397/eur.8152748., Federal Reserve Bank of St. Louis, GammaRoad Capital Partners, LLC. Past performance is not indicative of future results. Please see the important disclosures that are integral to understanding the limitations applicable to the quantitative information in the presentation.
To the degree that many institutional investors and wealth management firms utilize some form of mean-variance optimization (a process that is fraught with challenges when applied to a 10-year time horizon), market participants are looking at a capital allocation decision between two assets with increasingly comparable return expectations, positive correlation, and one that has much lower absolute volatility (U.S. Treasuries) than the other. Given these inputs, a standard mean-variance optimization calculator and its user will likely increase the weight to Treasuries at the expense of U.S. equities.
Note: this is not a recommendation to buy Treasuries or a prediction that Treasuries will outperform U.S. equities. Given the impressive rise in the stock market in recent years and the concurrent fall in Treasuries, this simplified exercise suggests we have likely not yet reached the point where the equity-versus-treasury risk/reward decision is clear cut and compelling to investors. But we are certainly moving closer as the 10-year yield rises further.
These transmission mechanisms (the discounting impact, refinancing risk, and competition for asset allocation) all represent an increasing risk to the current equity cycle. The question we often hear is when do rising rates matter enough to end the equity bull market? Beyond the fact that this question has no concrete answer, we believe investors should ask themselves a far more relevant question that can lead to better long-term outcomes:
Do you have an unlimited balance sheet, an infinite time horizon, and zero liquidity needs?
If not, we believe it makes sense to employ a repeatable, objectively measurable process that can potentially avoid the brunt of the next large drawdown. MVGMMA seeks to do exactly that. The strategy enters October with 2 of its 3 risk measures remaining bullish. This drives the strategy’s systematic process to maintain roughly 2/3rds S&P 500 exposure and roughly 1/3rd T-Bills exposure, i.e. the strategy’s risk measures suggest that market participation remains warranted despite the building interest rate-related risks outlined above. Regardless of when market trajectory changes course, we expect the strategy to reduce risk when market conditions have quantifiably deteriorated, as we have seen throughout the strategy’s research period and live track record:
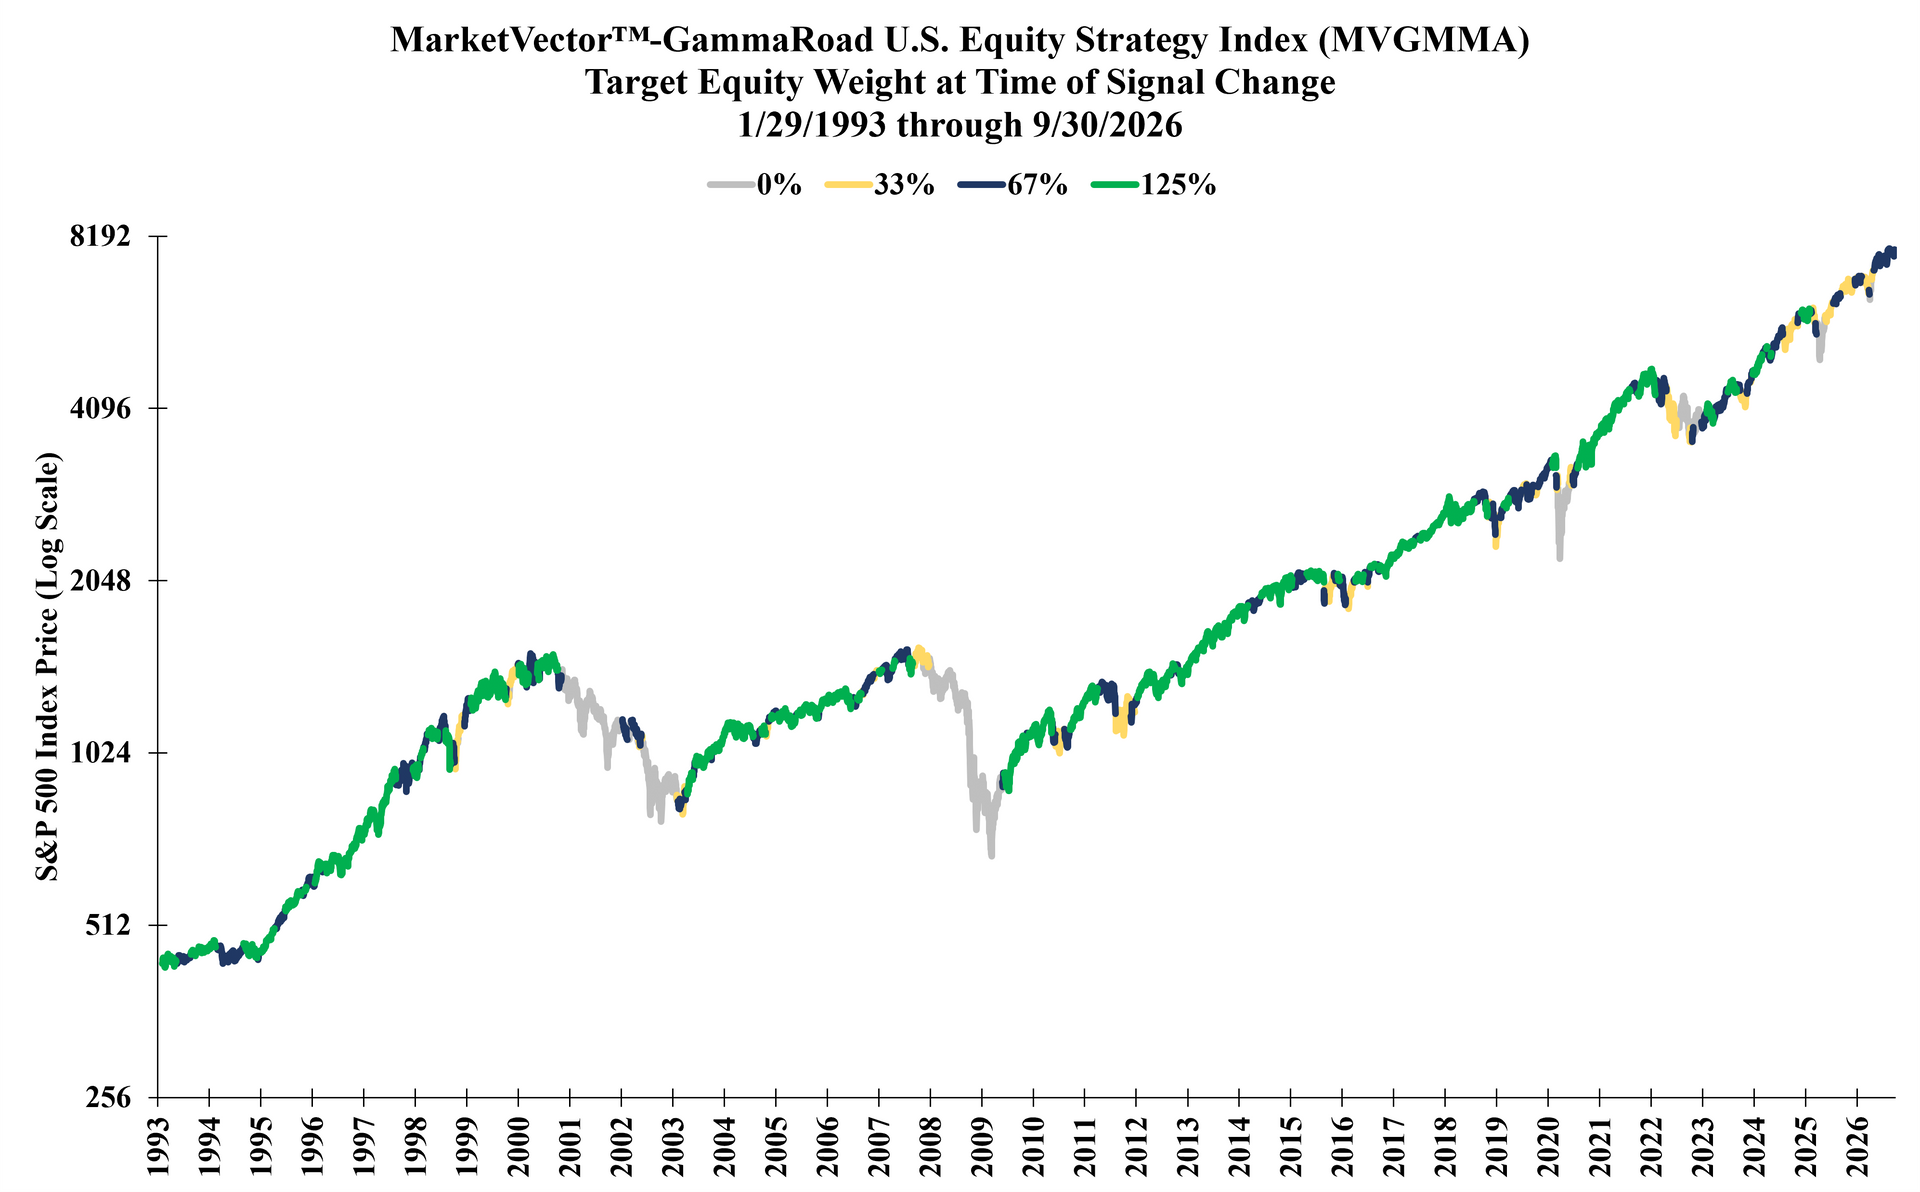
Source: GammaRoad Capital Partners, LLC. The S&P 500 Index is shown here on the y-axis to illustrate the index price level as the MarketVector™-GammaRoad U.S. Equity Strategy Index (Bloomberg: MVGMMA Index) target equity weight changes over time. The MVGMMA Index launched on December 22, 2023. Prior to December 22, 2023, the above target equity weight changes reflect backtested information based on the application of the MVGMMA Index methodology to the S&P 500 Index price data during periods when the MVGMMA Index was not actually published.
Please see the important disclosures
that are integral to understanding the limitations applicable to the quantitative information in the presentation.
For a refresher on the strategy’s architecture and underlying process, please watch our video here.
Important Disclosures
THIS PRESENTATION AND THE INFORMATION CONTAINED HEREIN WAS PREPARED BY GAMMAROAD CAPITAL PARTNERS, LLC (“GAMMAROAD”) AND IS SUBJECT TO AND QUALIFIED BY THE IMPORTANT DISCLOSURES BELOW.
Confidential
This presentation is directed solely to existing and potential users of the MarketVector™-GammaRoad U.S. Equity Strategy Index (Bloomberg: MVGMMA Index,
“MVGMMA Index”) and is furnished on a confidential basis only for the use of the recipient and only for discussion purposes. This presentation and its contents are proprietary information of GammaRoad and may not be reproduced or otherwise disseminated in whole or in part without GammaRoad’s prior written consent.
Not Advice or Recommendation
This presentation is neither advice nor a recommendation to enter into any transaction. This presentation is for information, illustration and discussion purposes only and is not intended as an offer to buy or sell, nor a solicitation of an offer to buy or sell, any security, commodity or other financial instrument. Nothing contained in this presentation is intended to represent the rendering of accounting, tax, legal, regulatory or investment advice by GammaRoad. While investors should understand and consider the risks associated with making an investment decision, this presentation should not be relied upon for that purpose and should not be a basis of any investment decision or retention of the MVGMMA Index. This presentation and the MVGMMA Index do not take into account the particular investment objectives, financial circumstances, restrictions, particular needs or financial, accounting, regulatory, legal or tax situation of any particular person, investor or type of investor. Neither GammaRoad nor its principals, officers, employees or associated funds or entities (all of the foregoing collectively, “Related Persons”) hereby makes any representation to any person or entity as to the suitability of the MVGMMA Index or any investments nor provide advice or recommendations regarding an investor’s decision to allocate funds based on the use of the MVGMMA Index or to maintain or sell investments based on the MVGMMA Index.
An investment decision by you to employ the MVGMMA Index in any capacity should be based on your independent judgment and customary and thorough due diligence procedures, including consultation with your own professional tax, legal and investment advisors. You should also inform yourself as to: (1) the legal requirements within your jurisdictions for the purchase, holding or disposal of investments; and (2) any income and other taxes which may apply to the purchase, holding and disposal of investments. Furthermore, you should keep in mind that any subsequent change in facts or circumstances could materially affect the accounting, tax, legal or regulatory treatment consequences of the MVGMMA Index and investments. Before you make any investment decisions based on the MVGMMA Index, you should determine whether the investment is suitable for you in light of your circumstances, investment objectives, financial situation and risk tolerance.
GammaRoad is not an Advisor or a Fiduciary
GammaRoad is not and does not purport to be an advisor as to legal, taxation, accounting, financial or regulatory matters in any jurisdiction. GammaRoad is not registered with any federal or state regulator and no fiduciary relationship under federal and/or state securities laws, the Commodity Exchange Act and/or ERISA is created by investing based on the MVGMMA Index, or through any communication with GammaRoad.
Limitation on Liability
No liability whatsoever is accepted for any loss (whether direct, indirect, or consequential) that may arise from any use of the information contained in or derived from this presentation or by use of the MVGMMA Index. In addition, GammaRoad, disclaims any and all liability as to the completeness or accuracy of the information contained herein and for any omissions of material facts. However, nothing herein shall in any way constitute a waiver or limitation of any rights available under applicable federal or state laws.
MVGMMA Index is Subject to Change
Please reference the MVGMMA Index Guide at www.marketvector.com/rulebooks/download/MVGMMA_Index_Guide.pdf for information regarding the development of the MVGMMA Index, its methodology and its risk management techniques.
Any changes to the Index Guide will be reviewed and approved by MarketVector Indexes (“MarketVector”) and MarketVector’s Legal and Compliance Department. MarketVector’s Legal and Compliance Department may also request a conclusive description and further information on any change and may consult MarketVector’s operations department on such changes. The key elements to be analyzed in this phase of the change process are robustness, transparency, reliability and integrity. The result of the review will be communicated to MarketVector’s operations department. The email will be archived by MarketVector’s operations department.
Changes that might immediately change the composition of the MVGMMA Index or must be considered material for any other reason also need to be approved by MarketVector’s Independent Oversight Function (“IOF”) prior to their publication and implementation.
In case of material changes an advance notice will be published and provided to users by MarketVector. MarketVector will generally disseminate a notification related to an Index Guide change 30 days prior to the change. A shorter period of time may be applied at MarketVector’s discretion if the relevant index has not been licensed for a financial product to a third party. The notice will describe a clear time frame that gives the opportunity to analyze and comment upon the impact of such proposed material change. Any material comments received in relation to the Index Guide change and MarketVector’s response to those comments will be made publicly accessible after any consultation, except where confidentiality has been requested by the originator of the comments.
Investment Performance
All performance information reflects the performance of the MarketVector™-GammaRoad U.S. Equity Strategy Index and does not reflect the trading of an actual account. The MVGMMA Index launched on December 22, 2023. Prior to December 22, 2023, all performance shown herein reflects backtested information based on the application of the MVGMMA Index methodology to the SPDR® S&P 500® ETF Trust (“SPY”) and the ProShares Ultra S&P500® (“SSO”) price and dividend data for the MVGMMA Index’s equity component during periods when the MVGMMA Index was not actually published. Prior to the inception of the SSO, the performance exhibits use twice the daily return of the SPY minus the daily equivalent of the SSO’s total expense ratio. For the non-equity component of the MVGMMA Index, the performance exhibits use the daily return and dividends for the SPDR® Bloomberg 1-3 Month T-Bill ETF (“BIL”). Prior to the inception of the BIL, the performance exhibits use a cash return that is the daily equivalent of the market yield on U.S. Treasury Securities at 3-Month Constant Maturity minus the daily equivalent of the BIL’s total expense ratio. The slides that show target equity weight changes apply the MVGMMA Index methodology to the S&P 500 Index price data during the periods shown. Both the S&P 500 TR and the S&P 500 Index (collectively the “S&P 500 Indices”) are indices comprised of the same 500 stocks chosen from all major industries based on market size, liquidity and industry grouping, among other factors. The difference between the S&P 500 TR and the S&P 500 Index is that the S&P 500 TR reflects the reinvestment of dividends while the S&P 500 Index does not. Investments cannot be made directly in broad-based securities indices. Therefore, the application of the MVGMMA Index methodology to the S&P 500 Indices is for illustration purposes only to demonstrate the efficacy of the MVGMMA Index methodology applied to these indices. January 29, 1993 was chosen as the base date for the MVGMMA Index so that the full research period would coincide with the inception of the SPDR® S&P 500® ETF Trust (“SPY”), which has the longest history amongst the largest and most liquid ETFs that passively track the S&P 500 Index. Additional information about the S&P 500 Indices and the U.S. Treasury Securities at 3-Month Constant Maturity is available from GammaRoad upon request.
The investment performance shown includes the reinvestment of dividends, interest and capital gains according to the MVGMMA Index and there was no withdrawal of cash during the performance period. In addition, you may pay brokerage commissions, exchange fees, and clearing fees to execute the MVGMMA Index methodology, none of which are subtracted in calculating the back-tested performance shown. Differences in the methodology used to calculate performance may also lead to different performance results than those shown. Annualized total return is computed on a compounded monthly basis. Volatility (standard deviation) and maximum drawdown percentage are computed on a daily basis. Beta and skew are computed on a monthly basis.
Back-tested performance is a type of hypothetical performance that cannot completely account for the impact of financial risk in actual management of a portfolio. In fact, there can be sharp differences between hypothetical performance results and the actual results subsequently achieved by any particular investment strategy due to many factors, some of which are described below. For example, the ability to withstand losses and adhere to the MVGMMA Index methodology in spite of trading losses is unknown and could have adversely affected actual results. Furthermore, back-tested performance results are prepared with the benefit of hindsight. This means that the MVGMMA Index has been formed in the present based in part on application of the MVGMMA Index methodology to the SPY, SSO, and BIL ETFs during the back-tested periods. The MVGMMA Index may have been constructed differently if GammaRoad did not have the benefit of its current hindsight and the MVGMMA Index may have performed significantly worse than the performance reflected herein. Furthermore, if the MVGMMA Index changes, the back-tested performance shown is not indicative of how the MVGMMA Index will perform if these changes occur. In addition, as noted above the back-tested performance shown does not subtract any brokerage commissions, exchange fees, and clearing fees. For the foregoing reasons and for numerous other reasons related to the markets, no representation is made that any investor using the MVGMMA Index will or is likely to achieve profits or losses similar to those shown.
Performance may vary substantially from year to year or even from month to month. Differences in the timing of transactions and market conditions prevailing at the time of investment may lead to different results. The value of investments can go down as well as up. Past performance is not indicative of future results and GammaRoad makes no representation that any user of the MVGMMA Index will or is likely to achieve profits or losses similar to those shown herein.
Benchmark Comparison
The performance shown is compared to the S&P 500 TR. The comparisons to the S&P 500 TR are included merely to show the general performance in the market in the periods indicated and is not intended to imply that the MVGMMA Index is similar to the S&P 500 TR in either composition or element of risk. Investments cannot be made directly in a broad-based securities index.
Risk of Loss and Other Risks
Investing in securities entails certain risks, including the possible loss of the entire principal amount invested. Volatility and returns depend on a variety of factors including overall market conditions, and unpredictable economic and political events.
All projections, valuations, and statistical analyses are provided to assist the recipient in the evaluation of the matters described herein. Such projections, valuations and analyses may be based on subjective assessments and assumptions and may use one among many alternative methodologies that produce different results; accordingly, such projections, valuations and statistical analyses should not be viewed as facts and should not be relied upon as an accurate prediction of future events.
Investments pursuant to the MVGMMA Index may be exposed to risks relating to non-U.S. markets, including, without limitation, risks relating to currency exchange, tax, lack of liquidity, market manipulation, political instability and higher transaction costs.
No representation is made that the MVGMMA Index's investment processes, investment objectives, goals or risk management techniques will or are likely to be achieved or successful, or that the MVGMMA Index methodology and/or any investment will make any profit or will not sustain losses. The MVGMMA Index may not be suitable for everyone.
Conflicts of Interest
GammaRoad’s Related Persons may invest personal assets pursuant to the MVGMMA Index methodology. To address potential conflicts of interest with the investing of users of the MVGMMA Index, GammaRoad has instituted an internal Personal Trading Policy with which all Related Persons are required to comply. With respect to each GammaRoad strategy, GammaRoad’s Personal Trading Policy seeks to allow users to have the opportunity to trade before and at better prices than Related Persons. A copy of GammaRoad’s Personal Trading Policy is available upon request.
Limitations on Information Contained Herein
This presentation is based on information including, but not limited to third-party benchmark information, that has been obtained from sources that GammaRoad believes to be reliable; however, such information has not been independently verified. GammaRoad (i) makes no representation as to, and accepts no responsibility or liability for, the accuracy, truthfulness or completeness of the information; (ii) and does not represent it as accurate, true or complete; (iii) makes no warranty, express or implied regarding it; and (iv) shall not be liable for any losses, damages, costs or expenses relating to its adequacy, accuracy, truth, completeness or use unless the waiver of such liability constitutes the waiver of any rights you may have under applicable federal or state laws.
The information in this presentation is current as of the date indicated and is subject to change or amendment. The delivery of this presentation at any time does not imply that the information contained herein is correct at any time subsequent to such date. GammaRoad undertakes no responsibility or obligation to revise or update this presentation and/or the opinions, statements, assumptions, analyses, assessments, projections, forward looking statements, similar statements and other views expressed in this presentation (collectively, the “Statements”). All Statements constitute only subjective views of GammaRoad, should not be relied on, and are subject to change without notice due to many factors, including fluctuating market conditions, and economic factors.